Precision Agriculture ( IF 5.4 ) Pub Date : 2023-05-01 , DOI: 10.1007/s11119-023-10024-w Vincent de Paul Obade , Charles Onyango Gaya , Paul Thomas Obade
|
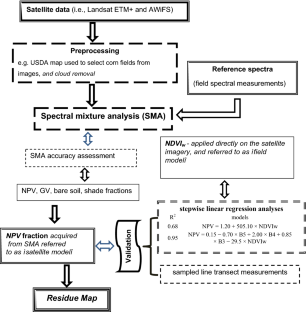
Timely information on within field soil quality spatial variability is pertinent for sustainable agroecosystem management. Although, plant residues constitute a critical input influencing soil quality dynamic, robust baseline residue maps to inform agricultural policy are nonexistent. Remote sensing-based indices can be used to generate maps that can provide timely information on within-field spatial distribution of residue cover. However, heavily used indices such as the Cellulose Absorption Index (CAI), Lignin Cellulose Absorption (LCA) index, or the Shortwave Infrared Normalized Difference Residue Index (SINDRI) rely on data scanned within the 2000 to 2500 nm spectral wavelength window, thus are impractical for mapping because most freely accessible spaceborne sensors collect significant data within the 450 to 1750 nm wavelength range. Here, insitu line transect residue cover measurements were integrated with spectral reflectance data scanned by Cropscan handheld multispectral radiometer (MSR) and satellite sensors, to identify alternative indices within the 450 to 1750 nm wavelength range suitable for monitoring residue cover. The green band reflectance had the highest correlation with spatial variability in residue cover, followed closely by the blue band. Analyzed data shows that Normalized Difference Vegetation Indexwide band (NDVIw), preeminently mapped corn (Zea mays) residue cover, with an R2 of 0.95 between residue mapped by satellite vis a vis in situ field measurements. The line transect residue measurements from field plots sampled at Aurora (48%) and Badger (57%) fell within the range estimated by satellite (30 to 60%), but this was not true for the Lennox site (72%).
中文翻译:
感知空间残差覆盖的统计诊断
关于田间土壤质量空间变异性的及时信息与可持续农业生态系统管理相关。尽管植物残留物构成了影响土壤质量动态的关键输入,但不存在为农业政策提供信息的可靠的基线残留物图。基于遥感的指数可用于生成地图,这些地图可以提供有关残留物覆盖的田间空间分布的及时信息。然而,纤维素吸收指数 (CAI)、木质素纤维素吸收 (LCA) 指数或短波红外归一化差异残留指数 (SINDRI) 等大量使用的指数依赖于在 2000 至 2500 nm 光谱波长窗口内扫描的数据,因此对于地图绘制不切实际,因为大多数可自由访问的星载传感器收集 450 至 1750 nm 波长范围内的重要数据。这里,原位线横断面残留物覆盖测量与 Cropscan 手持式多光谱辐射计 (MSR) 和卫星传感器扫描的光谱反射数据相结合,以识别 450 至 1750 nm 波长范围内适合监测残留物覆盖的替代指数。绿带反射率与残留物覆盖度的空间变异性相关性最高,紧随其后的是蓝带。分析数据表明,归一化差异植被指数 绿带反射率与残留物覆盖度的空间变异性相关性最高,紧随其后的是蓝带。分析数据表明,归一化差异植被指数 绿带反射率与残留物覆盖度的空间变异性相关性最高,紧随其后的是蓝带。分析数据表明,归一化差异植被指数宽波段(NDVI w ),出色绘制的玉米 ( Zea mays ) 残留物覆盖度,卫星绘制的残留物与现场实地测量之间的R 2为 0.95。在 Aurora (48%) 和 Badger (57%) 采样的田间样地的线横断面残留测量值落在卫星估计的范围内(30 至 60%),但 Lennox 站点(72%)并非如此。


 京公网安备 11010802027423号