Precision Agriculture ( IF 5.4 ) Pub Date : 2022-08-27 , DOI: 10.1007/s11119-022-09955-7 Ndiye M. Kebonye , Prince C. Agyeman , Zibanani Seletlo , Peter N. Eze
|
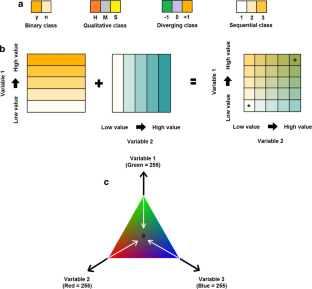
The benefits of digital soil maps cannot be overemphasised. For many years, researchers have mapped different soil classes, properties and processes while identifying the spatial associations between soil properties using side-by-side visualization maps. Although this is acceptable, it may be difficult to identify complex spatial associations between the mapped soil properties. For some, the task may be challenging owing to multiple times of side-by-side placing of the maps and the possible application of none user-friendly colour palettes and or schemes. Innovative tools are proposed for visualizing and identifying spatial associations between digital soil maps (raster layers) using bivariate and trivariate maps. These tools are applied in a case study to identify the spatial interactions between pH and selected macro-nutrients [nitrogen (N) and potassium (K)] of similar locality (Czech Republic), resolution and scale. This study further gives a brief overview of the applicability of bivariate and trivariate maps following the digital soil mapping process. Results show that bivariate and trivariate maps are effective for visualizing complex associations between pH and macro-nutrients. However, precautionary measures should be taken while applying bivariate and trivariate maps to ensure they are self-explanatory and that the legend colour schemes applied are user-friendly. Also, the variables mapped should be related. In this case, pH is a key soil quality indicator that affects macro-nutrient availability in soils.
Graphical abstract
中文翻译:
关于探索二元和三元地图作为数字土壤测绘中空间关联的可视化工具:关注土壤特性
数字土壤图的好处怎么强调都不为过。多年来,研究人员绘制了不同的土壤类别、特性和过程,同时使用并排的可视化地图识别土壤特性之间的空间关联。尽管这是可以接受的,但可能难以识别映射的土壤特性之间的复杂空间关联。对于一些人来说,由于地图多次并排放置以及可能使用非用户友好的调色板和/或方案,这项任务可能具有挑战性。提出了创新工具,用于使用二元和三元地图可视化和识别数字土壤图(栅格层)之间的空间关联。这些工具应用于案例研究,以确定 pH 值与相似位置(捷克共和国)、分辨率和规模的选定常量营养素 [氮 (N) 和钾 (K)] 之间的空间相互作用。本研究进一步简要概述了数字土壤测绘过程后二元和三元地图的适用性。结果表明,双变量和三变量图对于可视化 pH 值和大量营养素之间的复杂关联是有效的。但是,在应用二元和三元地图时应采取预防措施,以确保它们是不言自明的,并且应用的图例配色方案是用户友好的。此外,映射的变量应该是相关的。在这种情况下,pH 是影响土壤中大量养分有效性的关键土壤质量指标。


 京公网安备 11010802027423号