当前位置:
X-MOL 学术
›
NMR Biomed.
›
论文详情
Our official English website, www.x-mol.net, welcomes your
feedback! (Note: you will need to create a separate account there.)
Quantitative T1 mapping indicates tumor infiltration beyond the enhancing part of glioblastomas.
NMR in Biomedicine ( IF 2.7 ) Pub Date : 2019-12-26 , DOI: 10.1002/nbm.4242 Ulrike Nöth 1 , Julia Tichy 2 , Stephanie Tritt 3 , Oliver Bähr 2 , Ralf Deichmann 1 , Elke Hattingen 3
NMR in Biomedicine ( IF 2.7 ) Pub Date : 2019-12-26 , DOI: 10.1002/nbm.4242 Ulrike Nöth 1 , Julia Tichy 2 , Stephanie Tritt 3 , Oliver Bähr 2 , Ralf Deichmann 1 , Elke Hattingen 3
Affiliation
|
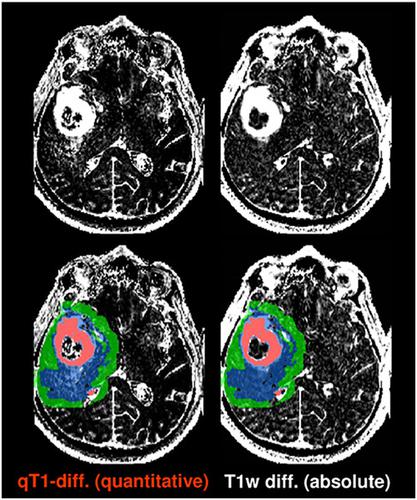
The aim of this study was to evaluate whether maps of quantitative T1 (qT1) differences induced by a gadolinium-based contrast agent (CA) are better suited than conventional T1-weighted (T1w) MR images for detecting infiltration inside and beyond the peritumoral edema of glioblastomas. Conventional T1w images and qT1 maps were obtained before and after gadolinium-based CA administration in 33 patients with glioblastoma before therapy. The following data were calculated: (i) absolute qT1-difference maps (qT1 pre-CA - qT1 post-CA), (ii) relative qT1-difference maps, (iii) absolute and (iv) relative differences of conventional T1w images acquired pre- and post-CA. The values of these four datasets were compared in four different regions: (a) the enhancing tumor, (b) the peritumoral edema, (c) a 5 mm zone around the pathology (defined as the sum of regions a and b), and (d) the contralateral normal appearing brain tissue. Additionally, absolute qT1-difference maps (displayed with linear gray scaling) were visually compared with respective conventional difference images. The enhancing tumor was visible both in the difference of conventional pre- and post-CA T1w images and in the absolute qT1-difference maps, whereas only the latter showed elevated values in the peritumoral edema and in some cases even beyond. Mean absolute qT1-difference values were significantly higher (P < 0.01) in the enhancing tumor (838 ± 210 ms), the peritumoral edema (123 ± 74 ms) and in the 5 mm zone around the pathology (81 ± 31 ms) than in normal appearing tissue (32 ± 35 ms). In summary, absolute qT1-difference maps-in contrast to the difference of T1w images-of untreated glioblastomas appear to be able to visualize CA leakage, and thus might indicate tumor cell infiltration in the edema region and beyond. Therefore, the absolute qT1-difference maps are potentially useful for treatment planning.
中文翻译:

定量的T1图谱表明胶质母细胞瘤的增强部分以外的肿瘤浸润。
这项研究的目的是评估由a基造影剂(CA)诱导的定量T1(qT1)差异图是否比常规T1加权(T1w)MR图像更适合检测肿瘤周围水肿内外的浸润胶质母细胞瘤。在治疗前,在33例胶质母细胞瘤患者中,以g为基础的CA给药前后,均获得了常规的T1w图像和qT1图。计算了以下数据:(i)绝对qT1差异图(qT1在CA前-qT1在CA之后),(ii)相对qT1差异图,(iii)采集的常规T1w图像的绝对和(iv)相对差异CA之前和之后。在四个不同区域对这四个数据集的值进行了比较:(a)肿瘤增强;(b)肿瘤周围水肿;(c)病理周围的5毫米区域(定义为区域a和b的总和),以及(d)对侧正常的脑组织。此外,在视觉上将绝对qT1差异图(以线性灰度显示)与相应的常规差异图像进行了比较。在常规CA T1w前后图像的差异以及绝对qT1差异图中均可见到增强的肿瘤,而只有后者显示出在肿瘤周围水肿中的升高值,在某些情况下甚至更高。在增强肿瘤(838±210 ms),肿瘤周围水肿(123±74 ms)和病理周围5 mm区域(81±31 ms)中,平均绝对qT1差值显着高于(P <0.01)。在正常出现的组织中(32±35 ms)。总之,未经处理的胶质母细胞瘤的绝对qT1差异图(与T1w图像的差异相反)似乎能够可视化CA渗漏,因此可能表明肿瘤细胞在水肿区域及其他区域浸润。因此,绝对的qT1差异图可能对治疗计划有用。
更新日期:2020-02-04
中文翻译:
定量的T1图谱表明胶质母细胞瘤的增强部分以外的肿瘤浸润。
这项研究的目的是评估由a基造影剂(CA)诱导的定量T1(qT1)差异图是否比常规T1加权(T1w)MR图像更适合检测肿瘤周围水肿内外的浸润胶质母细胞瘤。在治疗前,在33例胶质母细胞瘤患者中,以g为基础的CA给药前后,均获得了常规的T1w图像和qT1图。计算了以下数据:(i)绝对qT1差异图(qT1在CA前-qT1在CA之后),(ii)相对qT1差异图,(iii)采集的常规T1w图像的绝对和(iv)相对差异CA之前和之后。在四个不同区域对这四个数据集的值进行了比较:(a)肿瘤增强;(b)肿瘤周围水肿;(c)病理周围的5毫米区域(定义为区域a和b的总和),以及(d)对侧正常的脑组织。此外,在视觉上将绝对qT1差异图(以线性灰度显示)与相应的常规差异图像进行了比较。在常规CA T1w前后图像的差异以及绝对qT1差异图中均可见到增强的肿瘤,而只有后者显示出在肿瘤周围水肿中的升高值,在某些情况下甚至更高。在增强肿瘤(838±210 ms),肿瘤周围水肿(123±74 ms)和病理周围5 mm区域(81±31 ms)中,平均绝对qT1差值显着高于(P <0.01)。在正常出现的组织中(32±35 ms)。总之,未经处理的胶质母细胞瘤的绝对qT1差异图(与T1w图像的差异相反)似乎能够可视化CA渗漏,因此可能表明肿瘤细胞在水肿区域及其他区域浸润。因此,绝对的qT1差异图可能对治疗计划有用。


 京公网安备 11010802027423号