当前位置:
X-MOL 学术
›
Magn. Reson. Chem.
›
论文详情
Our official English website, www.x-mol.net, welcomes your feedback! (Note: you will need to create a separate account there.)
SAN plot: a Graphical representation of the signal, noise and artifacts content of spectra
Magnetic Resonance in Chemistry ( IF 2 ) Pub Date : 2019-06-23 , DOI: 10.1002/mrc.4882 Kirill F. Sheberstov 1 , Eduard Sistaré Guardiola 2 , Marion Pupier 2 , Damien Jeannerat 2
Magnetic Resonance in Chemistry ( IF 2 ) Pub Date : 2019-06-23 , DOI: 10.1002/mrc.4882 Kirill F. Sheberstov 1 , Eduard Sistaré Guardiola 2 , Marion Pupier 2 , Damien Jeannerat 2
Affiliation
|
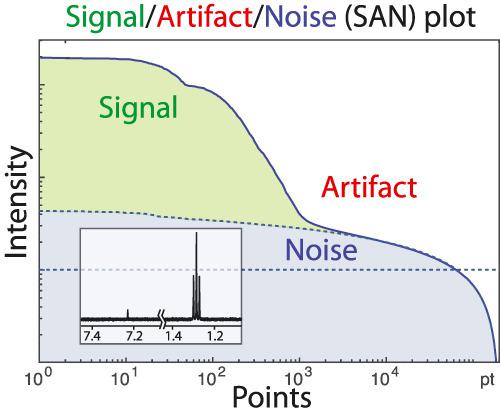
The signal‐to‐noise ratio is an important property of NMR spectra. It allows to compare the sensitivity of experiments, the performance of hardware, etc. Its measurement is usually done in a rudimentary manner involving manual operation of selecting separately a region of the spectrum with signal and noise, respectively, applying some operation and returning the signal‐to‐noise ratio. We introduce here a simple method based on the analysis of the distribution of point intensities in one‐ and two‐dimensional spectra. The signal/artifact/noise plots, (SAN plots) allows one to present in a graphical manner qualitative and quantitative information about spectra. It will be shown that besides measuring signal and noise levels, SAN plots are also quite useful to visualize and compare artifacts within a series of spectra. Some basic properties of the SAN plots are illustrated with simple application.
中文翻译:

SAN 图:光谱的信号、噪声和伪影内容的图形表示
信噪比是核磁共振谱的一个重要特性。它允许比较实验的灵敏度、硬件的性能等。它的测量通常以基本的方式完成,涉及手动操作,分别选择具有信号和噪声的频谱区域,应用一些操作并返回信号噪声比。我们在此介绍一种基于分析一维和二维光谱中点强度分布的简单方法。信号/伪像/噪声图(SAN 图)允许以图形方式呈现有关光谱的定性和定量信息。将显示除了测量信号和噪声水平之外,SAN 图对于在一系列光谱中可视化和比较伪影也非常有用。
更新日期:2019-06-23
中文翻译:
SAN 图:光谱的信号、噪声和伪影内容的图形表示
信噪比是核磁共振谱的一个重要特性。它允许比较实验的灵敏度、硬件的性能等。它的测量通常以基本的方式完成,涉及手动操作,分别选择具有信号和噪声的频谱区域,应用一些操作并返回信号噪声比。我们在此介绍一种基于分析一维和二维光谱中点强度分布的简单方法。信号/伪像/噪声图(SAN 图)允许以图形方式呈现有关光谱的定性和定量信息。将显示除了测量信号和噪声水平之外,SAN 图对于在一系列光谱中可视化和比较伪影也非常有用。


 京公网安备 11010802027423号