Our official English website, www.x-mol.net, welcomes your
feedback! (Note: you will need to create a separate account there.)
Trends in Dietary Carbohydrate, Protein, and Fat Intake and Diet Quality Among US Adults, 1999-2016
JAMA ( IF 63.1 ) Pub Date : 2019-09-24 , DOI: 10.1001/jama.2019.13771 Zhilei Shan 1, 2, 3 , Colin D Rehm 4 , Gail Rogers 2, 5 , Mengyuan Ruan 2, 6 , Dong D Wang 3 , Frank B Hu 3, 7, 8 , Dariush Mozaffarian 2 , Fang Fang Zhang 2, 5 , Shilpa N Bhupathiraju 3, 8
JAMA ( IF 63.1 ) Pub Date : 2019-09-24 , DOI: 10.1001/jama.2019.13771 Zhilei Shan 1, 2, 3 , Colin D Rehm 4 , Gail Rogers 2, 5 , Mengyuan Ruan 2, 6 , Dong D Wang 3 , Frank B Hu 3, 7, 8 , Dariush Mozaffarian 2 , Fang Fang Zhang 2, 5 , Shilpa N Bhupathiraju 3, 8
Affiliation
|
Importance
Changes in the economy, nutrition policies, and food processing methods can affect dietary macronutrient intake and diet quality. It is essential to evaluate trends in dietary intake, food sources, and diet quality to inform policy makers. Objective
To investigate trends in dietary macronutrient intake, food sources, and diet quality among US adults. Design, Setting, and Participants
Serial cross-sectional analysis of the US nationally representative 24-hour dietary recall data from 9 National Health and Nutrition Examination Survey cycles (1999-2016) among adults aged 20 years or older. Exposure
Survey cycle. Main Outcomes and Measures
Dietary intake of macronutrients and their subtypes, food sources, and the Healthy Eating Index 2015 (range, 0-100; higher scores indicate better diet quality; a minimal clinically important difference has not been defined). Results
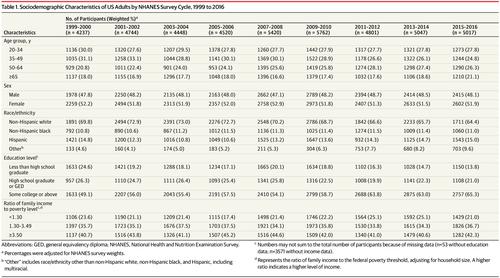
There were 43 996 respondents (weighted mean age, 46.9 years; 51.9% women). From 1999 to 2016, the estimated energy from total carbohydrates declined from 52.5% to 50.5% (difference, -2.02%; 95% CI, -2.41% to -1.63%), whereas that of total protein and total fat increased from 15.5% to 16.4% (difference, 0.82%; 95% CI, 0.67%-0.97%) and from 32.0% to 33.2% (difference, 1.20%; 95% CI, 0.84%-1.55%), respectively (all P < .001 for trend). Estimated energy from low-quality carbohydrates decreased by 3.25% (95% CI, 2.74%-3.75%; P < .001 for trend) from 45.1% to 41.8%. Increases were observed in estimated energy from high-quality carbohydrates (by 1.23% [95% CI, 0.84%-1.61%] from 7.42% to 8.65%), plant protein (by 0.38% [95% CI, 0.28%-0.49%] from 5.38% to 5.76%), saturated fatty acids (by 0.36% [95% CI, 0.20%-0.51%] from 11.5% to 11.9%), and polyunsaturated fatty acids (by 0.65% [95% CI, 0.56%-0.74%] from 7.58% to 8.23%) (all P < .001 for trend). The estimated overall Healthy Eating Index 2015 increased from 55.7 to 57.7 (difference, 2.01; 95% CI, 0.86-3.16; P < .001 for trend). Trends in high- and low-quality carbohydrates primarily reflected higher estimated energy from whole grains (0.65%) and reduced estimated energy from added sugars (-2.00%), respectively. Trends in plant protein were predominantly due to higher estimated intake of whole grains (0.12%) and nuts (0.09%). Conclusions and Relevance
From 1999 to 2016, US adults experienced a significant decrease in percentage of energy intake from low-quality carbohydrates and significant increases in percentage of energy intake from high-quality carbohydrates, plant protein, and polyunsaturated fat. Despite improvements in macronutrient composition and diet quality, continued high intake of low-quality carbohydrates and saturated fat remained.
中文翻译:

1999-2016 年美国成年人膳食碳水化合物、蛋白质和脂肪摄入量和饮食质量的趋势
重要性 经济、营养政策和食品加工方法的变化会影响膳食常量营养素的摄入和膳食质量。评估饮食摄入、食物来源和饮食质量的趋势以告知政策制定者至关重要。目的调查美国成年人膳食常量营养素摄入量、食物来源和膳食质量的趋势。设计、设置和参与者对 20 岁或以上成年人的 9 个国家健康和营养检查调查周期(1999-2016)中具有美国全国代表性的 24 小时膳食回忆数据进行系列横断面分析。暴露调查周期。主要成果和措施 膳食摄入的常量营养素及其亚型、食物来源和 2015 年健康饮食指数(范围,0-100;得分越高表明饮食质量越好;尚未定义最小的临床重要差异)。结果 共有 43 996 名受访者(加权平均年龄,46.9 岁;51.9% 为女性)。从 1999 年到 2016 年,总碳水化合物的估计能量从 52.5% 下降到 50.5%(差异,-2.02%;95% CI,-2.41% 到 -1.63%),而总蛋白质和总脂肪的估计能量从 15.5% 上升分别为 16.4%(差异,0.82%;95% CI,0.67%-0.97%)和从 32.0% 到 33.2%(差异,1.20%;95% CI,0.84%-1.55%)(所有 P < .001趋势)。来自低质量碳水化合物的估计能量从 45.1% 下降到 41.8%,下降了 3.25%(95% CI,2.74%-3.75%;趋势 P < .001)。观察到来自优质碳水化合物的估计能量增加(增加 1.23% [95% CI, 0.84%-1.61%] 从 7.42% 到 8.65%)、植物蛋白(增加 0.38% [95% CI, 0.28%-0.49% ] 从 5.38% 到 5.76%),饱和脂肪酸(0.36% [95% CI, 0.20%-0.51%] 从 11.5% 到 11.9%)和多不饱和脂肪酸(0.65% [95% CI, 0.56%-0.74%] 从 7.58% 到 8.23 %)(所有 P < .001 的趋势)。估计的 2015 年总体健康饮食指数从 55.7 增加到 57.7(差异,2.01;95% CI,0.86-3.16;趋势 P < .001)。高品质和低品质碳水化合物的趋势主要反映了来自全谷物的更高估计能量(0.65%)和来自添加糖的估计能量减少(-2.00%)。植物蛋白的趋势主要是由于全谷物(0.12%)和坚果(0.09%)的估计摄入量增加。1999 年至 2016 年的结论和相关性,美国成年人从低质量碳水化合物中摄入的能量百分比显着下降,而从高质量碳水化合物、植物蛋白和多不饱和脂肪中摄入的能量百分比显着增加。尽管常量营养素组成和饮食质量有所改善,但仍然大量摄入低质量碳水化合物和饱和脂肪。
更新日期:2019-09-24
中文翻译:
1999-2016 年美国成年人膳食碳水化合物、蛋白质和脂肪摄入量和饮食质量的趋势
重要性 经济、营养政策和食品加工方法的变化会影响膳食常量营养素的摄入和膳食质量。评估饮食摄入、食物来源和饮食质量的趋势以告知政策制定者至关重要。目的调查美国成年人膳食常量营养素摄入量、食物来源和膳食质量的趋势。设计、设置和参与者对 20 岁或以上成年人的 9 个国家健康和营养检查调查周期(1999-2016)中具有美国全国代表性的 24 小时膳食回忆数据进行系列横断面分析。暴露调查周期。主要成果和措施 膳食摄入的常量营养素及其亚型、食物来源和 2015 年健康饮食指数(范围,0-100;得分越高表明饮食质量越好;尚未定义最小的临床重要差异)。结果 共有 43 996 名受访者(加权平均年龄,46.9 岁;51.9% 为女性)。从 1999 年到 2016 年,总碳水化合物的估计能量从 52.5% 下降到 50.5%(差异,-2.02%;95% CI,-2.41% 到 -1.63%),而总蛋白质和总脂肪的估计能量从 15.5% 上升分别为 16.4%(差异,0.82%;95% CI,0.67%-0.97%)和从 32.0% 到 33.2%(差异,1.20%;95% CI,0.84%-1.55%)(所有 P < .001趋势)。来自低质量碳水化合物的估计能量从 45.1% 下降到 41.8%,下降了 3.25%(95% CI,2.74%-3.75%;趋势 P < .001)。观察到来自优质碳水化合物的估计能量增加(增加 1.23% [95% CI, 0.84%-1.61%] 从 7.42% 到 8.65%)、植物蛋白(增加 0.38% [95% CI, 0.28%-0.49% ] 从 5.38% 到 5.76%),饱和脂肪酸(0.36% [95% CI, 0.20%-0.51%] 从 11.5% 到 11.9%)和多不饱和脂肪酸(0.65% [95% CI, 0.56%-0.74%] 从 7.58% 到 8.23 %)(所有 P < .001 的趋势)。估计的 2015 年总体健康饮食指数从 55.7 增加到 57.7(差异,2.01;95% CI,0.86-3.16;趋势 P < .001)。高品质和低品质碳水化合物的趋势主要反映了来自全谷物的更高估计能量(0.65%)和来自添加糖的估计能量减少(-2.00%)。植物蛋白的趋势主要是由于全谷物(0.12%)和坚果(0.09%)的估计摄入量增加。1999 年至 2016 年的结论和相关性,美国成年人从低质量碳水化合物中摄入的能量百分比显着下降,而从高质量碳水化合物、植物蛋白和多不饱和脂肪中摄入的能量百分比显着增加。尽管常量营养素组成和饮食质量有所改善,但仍然大量摄入低质量碳水化合物和饱和脂肪。


 京公网安备 11010802027423号