Our official English website, www.x-mol.net, welcomes your
feedback! (Note: you will need to create a separate account there.)
The state of hypertension care in 44 low-income and middle-income countries: a cross-sectional study of nationally representative individual-level data from 1·1 million adults
The Lancet ( IF 98.4 ) Pub Date : 2019-07-18 , DOI: 10.1016/s0140-6736(19)30955-9 Pascal Geldsetzer , Jennifer Manne-Goehler , Maja-Emilia Marcus , Cara Ebert , Zhaxybay Zhumadilov , Chea S Wesseh , Lindiwe Tsabedze , Adil Supiyev , Lela Sturua , Silver K Bahendeka , Abla M Sibai , Sarah Quesnel-Crooks , Bolormaa Norov , Kibachio J Mwangi , Omar Mwalim , Roy Wong-McClure , Mary T Mayige , Joao S Martins , Nuno Lunet , Demetre Labadarios , Khem B Karki , Gibson B Kagaruki , Jutta M A Jorgensen , Nahla C Hwalla , Dismand Houinato , Corine Houehanou , Mohamed Msaidié , David Guwatudde , Mongal S Gurung , Gladwell Gathecha , Maria Dorobantu , Albertino Damasceno , Pascal Bovet , Brice W Bicaba , Krishna K Aryal , Glennis Andall-Brereton , Kokou Agoudavi , Andrew Stokes , Justine I Davies , Till Bärnighausen , Rifat Atun , Sebastian Vollmer , Lindsay M Jaacks
中文翻译:

44个低收入和中等收入国家的高血压护理状况:一项针对具有全国代表性的1·100万成年人的个人水平数据的横断面研究
更新日期:2019-08-23
The Lancet ( IF 98.4 ) Pub Date : 2019-07-18 , DOI: 10.1016/s0140-6736(19)30955-9 Pascal Geldsetzer , Jennifer Manne-Goehler , Maja-Emilia Marcus , Cara Ebert , Zhaxybay Zhumadilov , Chea S Wesseh , Lindiwe Tsabedze , Adil Supiyev , Lela Sturua , Silver K Bahendeka , Abla M Sibai , Sarah Quesnel-Crooks , Bolormaa Norov , Kibachio J Mwangi , Omar Mwalim , Roy Wong-McClure , Mary T Mayige , Joao S Martins , Nuno Lunet , Demetre Labadarios , Khem B Karki , Gibson B Kagaruki , Jutta M A Jorgensen , Nahla C Hwalla , Dismand Houinato , Corine Houehanou , Mohamed Msaidié , David Guwatudde , Mongal S Gurung , Gladwell Gathecha , Maria Dorobantu , Albertino Damasceno , Pascal Bovet , Brice W Bicaba , Krishna K Aryal , Glennis Andall-Brereton , Kokou Agoudavi , Andrew Stokes , Justine I Davies , Till Bärnighausen , Rifat Atun , Sebastian Vollmer , Lindsay M Jaacks
|
Background
Evidence from nationally representative studies in low-income and middle-income countries (LMICs) on where in the hypertension care continuum patients are lost to care is sparse. This information, however, is essential for effective targeting of interventions by health services and monitoring progress in improving hypertension care. We aimed to determine the cascade of hypertension care in 44 LMICs—and its variation between countries and population groups—by dividing the progression in the care process, from need of care to successful treatment, into discrete stages and measuring the losses at each stage.Methods
In this cross-sectional study, we pooled individual-level population-based data from 44 LMICs. We first searched for nationally representative datasets from the WHO Stepwise Approach to Surveillance (STEPS) from 2005 or later. If a STEPS dataset was not available for a LMIC (or we could not gain access to it), we conducted a systematic search for survey datasets; the inclusion criteria in these searches were that the survey was done in 2005 or later, was nationally representative for at least three 10-year age groups older than 15 years, included measured blood pressure data, and contained data on at least two hypertension care cascade steps. Hypertension was defined as a systolic blood pressure of at least 140 mm Hg, diastolic blood pressure of at least 90 mm Hg, or reported use of medication for hypertension. Among those with hypertension, we calculated the proportion of individuals who had ever had their blood pressure measured; had been diagnosed with hypertension; had been treated for hypertension; and had achieved control of their hypertension. We weighted countries proportionally to their population size when determining this hypertension care cascade at the global and regional level. We disaggregated the hypertension care cascade by age, sex, education, household wealth quintile, body-mass index, smoking status, country, and region. We used linear regression to predict, separately for each cascade step, a country's performance based on gross domestic product (GDP) per capita, allowing us to identify countries whose performance fell outside of the 95% prediction interval.Findings
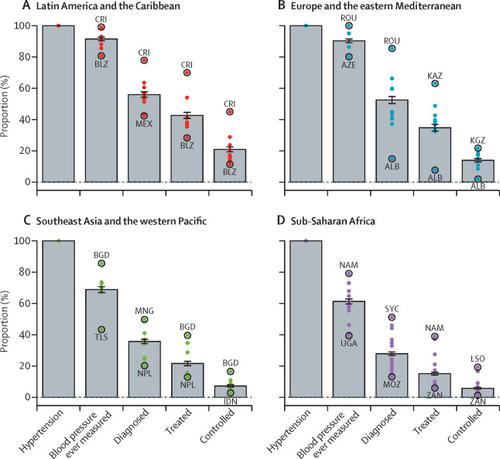
Our pooled dataset included 1 100 507 participants, of whom 192 441 (17·5%) had hypertension. Among those with hypertension, 73·6% of participants (95% CI 72·9–74·3) had ever had their blood pressure measured, 39·2% of participants (38·2–40·3) had been diagnosed with hypertension, 29·9% of participants (28·6–31·3) received treatment, and 10·3% of participants (9·6–11·0) achieved control of their hypertension. Countries in Latin America and the Caribbean generally achieved the best performance relative to their predicted performance based on GDP per capita, whereas countries in sub-Saharan Africa performed worst. Bangladesh, Brazil, Costa Rica, Ecuador, Kyrgyzstan, and Peru performed significantly better on all care cascade steps than predicted based on GDP per capita. Being a woman, older, more educated, wealthier, and not being a current smoker were all positively associated with attaining each of the four steps of the care cascade.Interpretation
Our study provides important evidence for the design and targeting of health policies and service interventions for hypertension in LMICs. We show at what steps and for whom there are gaps in the hypertension care process in each of the 44 countries in our study. We also identified countries in each world region that perform better than expected from their economic development, which can direct policy makers to important policy lessons. Given the high disease burden caused by hypertension in LMICs, nationally representative hypertension care cascades, as constructed in this study, are an important measure of progress towards achieving universal health coverage.Funding
Harvard McLennan Family Fund, Alexander von Humboldt Foundation.中文翻译:
44个低收入和中等收入国家的高血压护理状况:一项针对具有全国代表性的1·100万成年人的个人水平数据的横断面研究


 京公网安备 11010802027423号