Precision Agriculture ( IF 5.4 ) Pub Date : 2023-03-17 , DOI: 10.1007/s11119-023-09998-4 Ricardo Sobjak , Eduardo Godoy de Souza , Claudio Leones Bazzi , Miguel Angel Uribe Opazo , Erivelto Mercante , Jorge Aikes Junior
|
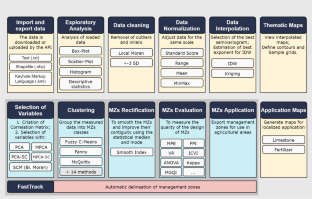
Thematic maps are essential tools in precision agriculture to demonstrate the information of spatially distributed phenomena. A thematic map can be created from sampling data, a standard procedure for soil attributes. Interpolation methods are used to estimate data in unknown locations, such as inverse distance weighting (IDW) and ordinary Kriging (OK). For both interpolators, it is essential to use the appropriate parameters to estimate values in non-sampled locations, either the exponent value and the number of neighbors for IDW, or the theoretical model adjusted to the experimental semivariogram for OK. Thus, this trial aims at adopting additional criteria in selecting interpolators and evaluating their performance. AgDataBox platform’s data interpolation module was improved, where the process of selecting the interpolator and determining its parameters considers the criteria (i) effective spatial dependence index, (ii) the first semivariance significance index, and (iii) slope of the model ends index. The experimental data come from an experiment in two agricultural areas in Brazil, using grids with good sampling density (2.7, 2.6, and 3.5 points per ha). It was observed that, usually, the application method of the three new criteria selected different models for a dataset and this must be considered in the interpolator selection process. Thematic maps varied from 0.1 to 64%, according to the coefficient of relative deviation, when comparing the three methods of applying the selection criteria.
中文翻译:
选择最佳插值器及其参数创建专题图的过程改进
专题地图是精准农业中展示空间分布现象信息的重要工具。可以根据采样数据创建专题图,这是土壤属性的标准程序。插值方法用于估计未知位置的数据,例如反距离加权法(IDW)和普通克里金法(OK)。对于两个插值器,必须使用适当的参数来估计非采样位置的值,IDW 的指数值和邻居数,或调整为 OK 的实验半变异函数的理论模型。因此,本试验旨在采用额外的标准来选择内插器和评估其性能。改进了AgDataBox平台的数据插值模块,其中选择插值器和确定其参数的过程考虑标准 (i) 有效空间相关指数,(ii) 第一半方差显着性指数,以及 (iii) 模型结束指数的斜率。实验数据来自巴西两个农业区的实验,使用具有良好采样密度(每公顷 2.7、2.6 和 3.5 个点)的网格。据观察,通常,三个新标准的应用方法会为数据集选择不同的模型,这在插值器选择过程中必须加以考虑。在比较应用选择标准的三种方法时,根据相对偏差系数,专题地图从 0.1% 到 64% 不等。(iii) 模型结束指数的斜率。实验数据来自巴西两个农业区的实验,使用具有良好采样密度(每公顷 2.7、2.6 和 3.5 个点)的网格。据观察,通常,三个新标准的应用方法会为数据集选择不同的模型,这在插值器选择过程中必须加以考虑。在比较应用选择标准的三种方法时,根据相对偏差系数,专题地图从 0.1% 到 64% 不等。(iii) 模型结束指数的斜率。实验数据来自巴西两个农业区的实验,使用具有良好采样密度(每公顷 2.7、2.6 和 3.5 个点)的网格。据观察,通常,三个新标准的应用方法会为数据集选择不同的模型,这在插值器选择过程中必须加以考虑。在比较应用选择标准的三种方法时,根据相对偏差系数,专题地图从 0.1% 到 64% 不等。三个新标准的应用方法为数据集选择了不同的模型,在插值器选择过程中必须考虑到这一点。在比较应用选择标准的三种方法时,根据相对偏差系数,专题地图从 0.1% 到 64% 不等。三个新标准的应用方法为数据集选择了不同的模型,在插值器选择过程中必须考虑到这一点。在比较应用选择标准的三种方法时,根据相对偏差系数,专题地图从 0.1% 到 64% 不等。


 京公网安备 11010802027423号