Precision Agriculture ( IF 5.4 ) Pub Date : 2023-02-24 , DOI: 10.1007/s11119-023-09994-8 Gabriele Silva de Almeida , Rodnei Rizzo , Merilyn Taynara Accorsi Amorim , Natasha Valadares dos Santos , Jorge Tadeu Fim Rosas , Lucas Rabelo Campos , Nícolas Augusto Rosin , André Vinicius Zabini , José A. M. Demattê
|
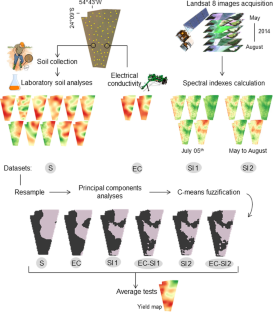
In modern agriculture, understanding the spatio-temporal variability in crop fields and the implications of environmental factors in soil management are important for sustainable practices. In this case, the management zones (MZ) can aid agricultural practices by indicating locations in a crop field where the production might be restricted and requires a specific management. Currently, there are many datasets and methodological strategies for designing MZs, and the outcomes from these methods are quite different. Therefore, this research aims to compare the performance of different remote/proximal sensing inputs to retrieve data from soil and plants, define their relationship with corn yield, and the potential of these datasets to design MZs. The study was conducted at a corn field located in Paraguay. The datasets used in our methodology corresponded to (I) electrical conductivity, (II) soil data from conventional laboratory analysis and (III) spectral information (optical and thermal) derived from Landsat 8 images. MZs were generated from each one of the datasets and later they were compared to yield maps. In this case, zoning performances were evaluated by the similarity between MZs and yield maps. The best results were achieved with the spectral vegetation indices from Landsat 8. Correlations between vegetation indexes and yield reached a maximum value of 0.75 for NBR2 index, but EVI, SAVI and NDVI also presented good results (r > 0.7). Furthermore, vegetation indexes of corn at V8 phenological stage provided the best agreement between MZs and yield. Finally, the MZs derived from spectral data could define yield-limiting zones inside the crop field.
中文翻译:
通过卫星植被指数、土壤电导率和管理区监测土壤-植物相互作用和玉米产量
在现代农业中,了解农田的时空变化以及土壤管理中环境因素的影响对于可持续实践非常重要。在这种情况下,管理区 (MZ) 可以通过指示作物田中可能限制生产并需要特定管理的位置来帮助农业实践。目前,有许多用于设计 MZ 的数据集和方法策略,这些方法的结果也大不相同。因此,本研究旨在比较不同遥感/近端传感输入的性能,以从土壤和植物中检索数据,定义它们与玉米产量的关系,以及这些数据集设计 MZ 的潜力。该研究是在巴拉圭的一片玉米地进行的。我们的方法中使用的数据集对应于 (I) 电导率,(II) 来自常规实验室分析的土壤数据和 (III) 来自 Landsat 8 图像的光谱信息(光学和热学)。MZ 从每个数据集生成,随后将它们与产量图进行比较。在这种情况下,分区性能通过 MZ 和产量图之间的相似性进行评估。Landsat 8 的光谱植被指数取得了最好的结果。植被指数与产量之间的相关性在 NBR2 指数中达到最大值 0.75,但 EVI、SAVI 和 NDVI 也呈现出良好的结果(r > 0.7)。此外,V8 物候期玉米的植被指数提供了 MZ 与产量之间的最佳一致性。最后,


 京公网安备 11010802027423号