Precision Agriculture ( IF 5.4 ) Pub Date : 2023-02-08 , DOI: 10.1007/s11119-022-09984-2 A. Kasimati , V. Psiroukis , N. Darra , A. Kalogrias , D. Kalivas , J. A. Taylor , S. Fountas
|
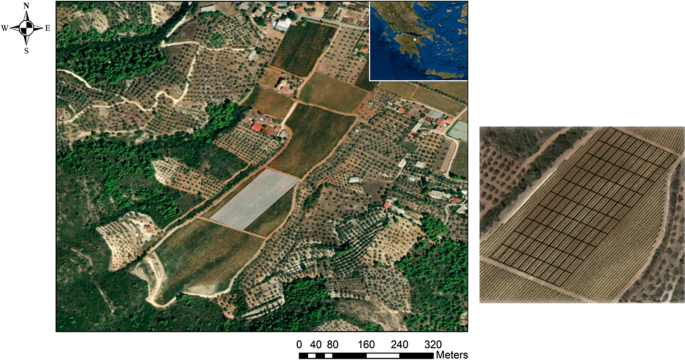
Vegetation indices (VI), especially the normalised difference vegetation index (NDVI), are used to determine management units (MU) and to explain quantity and quality of vineyard production. How do NDVI maps from different sensing technologies differ in a production context? What part of the variability of yield and quality can they explain? This study compares high-resolution multispectral, multi-temporal data from CropCircle, SpectroSense + GPS, Parrot Sequoia + multispectral camera equipped UAV, and Sentinel-2 imagery over two seasons (2019 and 2020). The objective was to assess whether the date of data collection (phenological growth stage) influences the correlations between NDVI and crop production. The comparison of vineyard NDVI data from proximal and remote sensing in both a statistical and a productive context showed strong similarities between NDVI values from similar sensors (0.69 < r < 0.96), but divergences between proximal and airborne/spaceborne observations. Exploratory correlation analysis between NDVI layers and grape yield and total soluble solids data (TSS) showed high correlations (maximum |r|= 0.91 and |r|= 0.74, respectively), with correlations increasing as the season progressed. No relationship with must titratable acidity or pH was found. Finally, proximal sensors explained better the variability in yield and quality for grapes in the early and late growth stages. The UAV's MUs described the yield of both years better than the other sensors. In 2019, the PCA-based MUs explained the TSS variability better than the UAV-related zones. Due to their coarse spatial resolution, the satellite data proved inconsistent in explaining the variability.
中文翻译:
研究来自不同近端和遥感平台的 NDVI 地图在解释葡萄园变异性方面的相似性
植被指数 (VI),尤其是归一化植被指数 (NDVI),用于确定管理单位 (MU) 并解释葡萄园生产的数量和质量。来自不同传感技术的 NDVI 地图在生产环境中有何不同?他们可以解释产量和质量的哪一部分变化?本研究比较了来自 CropCircle、SpectroSense + GPS、Parrot Sequoia + 配备多光谱相机的无人机以及两个季节(2019 年和 2020 年)的 Sentinel-2 图像的高分辨率多光谱、多时相数据。目的是评估数据收集日期(物候生长期)是否影响 NDVI 与作物产量之间的相关性。在统计和生产环境中对来自近端和遥感的葡萄园 NDVI 数据进行比较表明,来自类似传感器的 NDVI 值之间有很强的相似性 (0.69 < r < 0.96),但近端和机载/星载观测之间存在差异。NDVI 层与葡萄产量和总可溶性固体数据 (TSS) 之间的探索性相关分析显示出高度相关性(最大值分别为 |r|= 0.91 和 |r|= 0.74),相关性随着季节的进展而增加。未发现与必须滴定酸度或 pH 值的关系。最后,近端传感器更好地解释了葡萄在早期和晚期生长阶段的产量和质量的变化。无人机的 MU 比其他传感器更好地描述了这两年的产量。2019年,基于 PCA 的 MU 比 UAV 相关区域更好地解释了 TSS 可变性。由于空间分辨率较差,卫星数据在解释变异性方面被证明是不一致的。


 京公网安备 11010802027423号