Water Research ( IF 11.4 ) Pub Date : 2022-09-25 , DOI: 10.1016/j.watres.2022.119170 Poonam R Kulkarni 1 , Kenneth L Walker 1 , Charles J Newell 1 , Kayvan Karimi Askarani 2 , Yue Li 1 , Thomas E McHugh 1
|
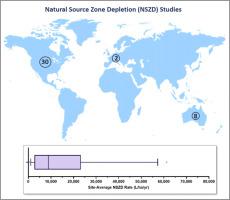
Site-average Natural Source Zone Depletion (NSZD) rates measured from 40 petroleum light non-aqueous phase liquid (LNAPL) source zone sites were compiled from researchers, project reports, and scientific papers. At each site, the following data were compiled: i) general site location; ii) LNAPL fuel type; iii) measurement method, number of locations, and number of measurements per location; and iv) calculated site-average NSZD rate in liters per hectare per year (L/ha/yr) per site and the associated measurement method (i.e., Gradient Method, Carbon Traps, Dynamic Closed Chamber (DCC), or Thermal Monitoring). The resulting dataset showed site-average NSZD rates that ranged from 650 to 152,000 L/ha/yr (70 to 16,250 gallons per acre per year (gal/acre/yr)), with a median value of 9,540 L/ha/yr (1,020 gal/acre/yr). The median site-average NSZD rate by type of fuel spill did not show a statistically significant difference between fuel types. When comparing the different NSZD measurement methods applied to the same sites, the site-average NSZD rates differed by up to 4.8 times (i.e., ratio of faster rate to slower rate), with a median difference of 2.1 times. No clear bias was observed between NSZD rate measurement methods. At four sites with calculations of NSZD rates by season, NSZD rates were typically higher during summer and fall compared to winter and spring. For these sites, Q10 values (a measure of the increase in NSZD rate associated with a 10 °C increase in temperature) ranged from 0.8 to 15.1, with a median of 2.2. The implications of this study suggest that increasing mean annual soil temperature at a site using engineered methods could potentially increase the biodegradation rate (e.g., an increase of 10 °C could double the NSZD rate). Finally, for five sites with site-average NSZD rates for multiple years, average NSZD rates varied by 1.1 to 4.9 times across years. Overall, the evaluation of NSZD rates measured at 40 LNAPL sites suggests that measurable NSZD occurs across a broad range of LNAPL sites. Although NSZD rates vary across sites, fuel type is not the primary factor explaining observed differences in rates.
中文翻译:
来自超过 15 年研究和测量的天然源区枯竭 (NSZD) 见解:多地点研究
从研究人员、项目报告和科学论文中汇编了从 40 个石油轻质非水相液体 (LNAPL) 源区站点测量的站点平均天然源区消耗 (NSZD) 率。在每个站点,汇总了以下数据: i) 一般站点位置;ii) LNAPL 燃料类型;iii) 测量方法、位置数量和每个位置的测量数量;iv) 计算出的场地平均 NSZD 率,单位为每个场地的升/公顷每年 (L/ha/yr) 以及相关的测量方法(即梯度法、碳捕集器、动态密闭室 (DCC) 或热监测)。生成的数据集显示场地平均 NSZD 率在 650 到 152,000 升/公顷/年(每年每英亩 70 到 16,250 加仑 (gal/acre/yr))之间,中值为 9,540 升/公顷/年( 1,020 加仑/英亩/年)。按燃料泄漏类型划分的现场平均 NSZD 率的中位数在燃料类型之间没有显示出统计学上的显着差异。当比较应用于相同站点的不同 NSZD 测量方法时,站点平均 NSZD 率差异高达 4.8 倍(即较快速率与较慢速率的比率),中位数差异为 2.1 倍。NSZD 速率测量方法之间没有观察到明显的偏差。在按季节计算 NSZD 率的四个地点,与冬季和春季相比,夏季和秋季的 NSZD 率通常更高。对于这些网站,Q 中位数相差 2.1 倍。NSZD 速率测量方法之间没有观察到明显的偏差。在按季节计算 NSZD 率的四个地点,与冬季和春季相比,夏季和秋季的 NSZD 率通常更高。对于这些网站,Q 中位数相差 2.1 倍。NSZD 速率测量方法之间没有观察到明显的偏差。在按季节计算 NSZD 率的四个地点,与冬季和春季相比,夏季和秋季的 NSZD 率通常更高。对于这些网站,Q10 个值(与温度升高 10°C 相关的 NSZD 速率增加的量度)范围为 0.8 至 15.1,中位数为 2.2。这项研究的意义表明,使用工程方法提高场地的年平均土壤温度可能会提高生物降解率(例如,升高 10 °C 可能会使 NSZD 速率增加一倍)。最后,对于具有多年站点平均 NSZD 率的五个站点,平均 NSZD 率多年来变化 1.1 到 4.9 倍。总体而言,对在 40 个 LNAPL 地点测量的 NSZD 率的评估表明,可测量的 NSZD 发生在广泛的 LNAPL 地点。尽管 NSZD 费率因地点而异,但燃料类型并不是解释观察到的费率差异的主要因素。


 京公网安备 11010802027423号