Cereal Research Communications ( IF 1.6 ) Pub Date : 2022-08-16 , DOI: 10.1007/s42976-022-00298-7 Muhammad Faheem , Saima Mir Arain , Mahboob Ali Sial , Khalil Ahmed Laghari , Abdul Qayyum
|
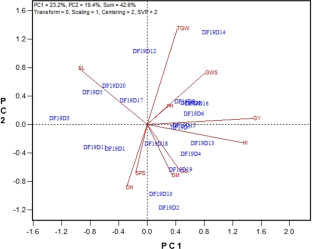
A novel genotype by yield*trait (GYT) biplot approach was applied in the present study to select the superior durum wheat advanced lines based on multiple traits from the panel of 20 genotypes. Our findings suggested that genotype by trait (GT) biplot explained less total variation (42.6%) as compared to GYT biplot (85.1%). The tester vector view of GYT biplot revealed the positive strong correlation among most of the grain yield (GY) trait combinations. The which-won-where view of GYT biplot divided the polygon into six sectors, out of which only two sectors possessed the yield trait combinations. The first sector harbored three yield trait combinations, viz., GY*grain weight per spike (GWS), GY*spike length (SL) and GY*thousand grains weight (TGW), and five genotypes (DF19D7, DF19D8, DF19D9, DF19D14, and DF19D16) for which DF19D14 was the winner genotype. However, genotype DF19D13 was the polygon vortex of the other sector having GY*number of grains per spike (GS), GY*number of spikelets per spike (SPS), GY*harvest index (HI), GY*plant height (PH), GY* days to heading (DH), and GY*days to physiological maturity (DM) yield trait combinations and encompassed six contesting genotypes (DF19D4, DF19D6, DF19D13, DF19D15, DF19D18, and DF19D19). The average tester coordination (ATC) biplot categorized 12 advanced lines as better performers than the average and ranked as DF19D13 > DF19D14 > DF19D4 > DF19D16 > DF19D12 > DF19D9 > DF19D7 > DF19D19 > DF19D18 > DF19D15 > DF19D6 > DF19D8, while designated eight as inferior genotypes, performed below the average mark. Overall, these findings indicated that the genotypes (DF19D13 and DF19D14) had the right combination of traits of interest required to produce higher yield and hence are potentially valuable candidates to be tested in multi-location trials for stable performance prior to release for farmer community.
中文翻译:
产量*性状基因型(GYT)双图分析:一种评估硬质小麦先行品系的新方法
本研究采用新的产量*性状基因型 (GYT) 双图方法从 20 个基因型的面板中选择基于多个性状的优质硬粒小麦先进品系。我们的研究结果表明,与 GYT 双图 (85.1%) 相比,性状基因型 (GT) 双图解释的总变异 (42.6%) 较少。GYT 双标图的测试向量视图显示了大多数谷物产量 (GY) 性状组合之间的强正相关。GYT biplot 的 which-won-where 视图将多边形划分为六个扇区,其中只有两个扇区具有产量性状组合。第一个部门包含三种产量性状组合,即GY* 每穗粒重 (GWS)、GY* 穗长 (SL) 和 GY* 千粒重 (TGW),以及 DF19D14 是获胜基因型的五个基因型(DF19D7、DF19D8、DF19D9、DF19D14 和 DF19D16)。然而,基因型 DF19D13 是另一个扇区的多边形涡旋,具有 GY* 每穗粒数 (GS)、GY* 每穗粒数 (SPS)、GY*收获指数 (HI)、GY*株高 (PH) 、GY* 抽穗天数 (DH) 和 GY* 天数到生理成熟 (DM) 产量性状组合并包含六种竞争基因型(DF19D4、DF19D6、DF19D13、DF19D15、DF19D18 和 DF19D19)。平均测试人员协调 (ATC) 双标图将 12 条先进生产线分类为优于平均水平的性能,排名为 DF19D13 > DF19D14 > DF19D4 > DF19D16 > DF19D12 > DF19D9 > DF19D7 > DF19D19 > DF19D18 > DF19D15 > DF19D6 > DF19D8 虽然被指定为 8 个劣等基因型,但表现低于平均水平。总体而言,这些研究结果表明,基因型(DF19D13 和 DF19D14)具有产生更高产量所需的目标性状的正确组合,因此是潜在有价值的候选者,可在多地点试验中进行测试,以在向农民社区发布之前获得稳定的性能。


 京公网安备 11010802027423号