npj Digital Medicine ( IF 12.4 ) Pub Date : 2022-08-10 , DOI: 10.1038/s41746-022-00647-0 Nadir Sella 1, 2, 3 , Anne-Sophie Hamy 2, 4, 5 , Vincent Cabeli 3 , Lauren Darrigues 5 , Marick Laé 6, 7 , Fabien Reyal 2, 5 , Hervé Isambert 3
|
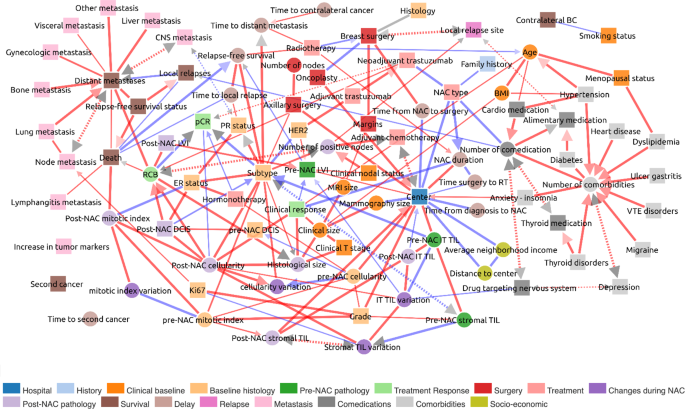
Despite unprecedented amount of information now available in medical records, health data remain underexploited due to their heterogeneity and complexity. Simple charts and hypothesis-driven statistics can no longer apprehend the content of information-rich clinical data. There is, therefore, a clear need for powerful interactive visualization tools enabling medical practitioners to perceive the patterns and insights gained by state-of-the-art machine learning algorithms. Here, we report an interactive graphical interface for use as the front end of a machine learning causal inference server (MIIC), to facilitate the visualization and comprehension by clinicians of relationships between clinically relevant variables. The widespread use of such tools, facilitating the interactive exploration of datasets, is crucial both for data visualization and for the generation of research hypotheses. We demonstrate the utility of the MIIC interactive interface, by exploring the clinical network of a large cohort of breast cancer patients treated with neoadjuvant chemotherapy (NAC). This example highlights, in particular, the direct and indirect links between post-NAC clinical responses and patient survival. The MIIC interactive graphical interface has the potential to help clinicians identify actionable nodes and edges in clinical networks, thereby ultimately improving the patient care pathway.
中文翻译:
来自大型乳腺癌队列的全球临床网络的交互式探索
尽管现在医疗记录中提供了前所未有的信息量,但由于其异质性和复杂性,健康数据仍未得到充分利用。简单的图表和假设驱动的统计数据不再能够理解信息丰富的临床数据的内容。因此,显然需要强大的交互式可视化工具,使医学从业者能够感知由最先进的机器学习算法获得的模式和见解。在这里,我们报告了一个交互式图形界面,用作机器学习因果推理服务器 (MIIC) 的前端,以促进临床医生对临床相关变量之间关系的可视化和理解。此类工具的广泛使用,促进了数据集的交互式探索,对于数据可视化和研究假设的产生都至关重要。我们通过探索接受新辅助化疗 (NAC) 治疗的大量乳腺癌患者的临床网络,展示了 MIIC 交互式界面的实用性。这个例子特别强调了 NAC 后临床反应和患者生存之间的直接和间接联系。MIIC 交互式图形界面有可能帮助临床医生识别临床网络中的可操作节点和边缘,从而最终改善患者护理路径。NAC 后临床反应与患者生存率之间的直接和间接联系。MIIC 交互式图形界面有可能帮助临床医生识别临床网络中的可操作节点和边缘,从而最终改善患者护理路径。NAC 后临床反应与患者生存率之间的直接和间接联系。MIIC 交互式图形界面有可能帮助临床医生识别临床网络中的可操作节点和边缘,从而最终改善患者护理路径。


 京公网安备 11010802027423号