Precision Agriculture ( IF 5.4 ) Pub Date : 2022-08-01 , DOI: 10.1007/s11119-022-09939-7 Felipe Cardoso de Oliveira Maia , Vinícius Bof Bufon , Tairone Paiva Leão
|
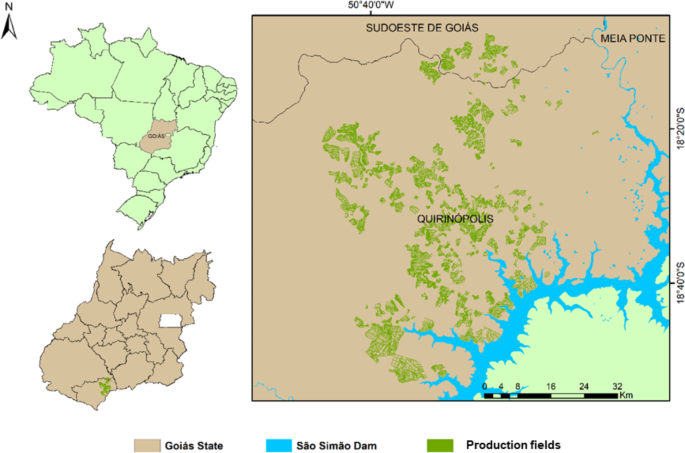
In precision agriculture, the adoption of management zones (MZs) is one of the most effective strategies for increasing agricultural efficiency. Currently, MZs in sugarcane production areas are classified based on conventional soil sampling, which demands a lot of time, labor and financial resources. Remote sensing (RS) combined with vegetation indices (VIs) is a promising alternative to support the traditional classification method, especially because it does not require physical access to the areas of interest, is cost-effective and less labor-intensive, and allows fast and easy coverage of large areas. The objective of this study was to evaluate the ability of the normalized difference vegetation index (NDVI) and the two-band enhanced vegetation index (EVI2) to classify sugarcane MZs, compared with the conventional method, in the Brazilian Cerrado biome (savannah), where about half of Brazil´s sugarcane production takes place. This study used historical crop production data from 5,500 production fields in three agricultural years (2015 to 2018) and NDVI and EVI2 values of 14 images acquired by the Landsat 8 satellite from 2015 to 2018 in Google Earth Engine (GEE). Although improvements are still necessary and encouraged, a new methodology of classifying MZs according to VIs was proposed in this study. The NDVI was not correlated with MZs classified using the conventional method, whereas EVI2 was more sensitive to biomass variations between MZs and, therefore, could better discriminate between MZs. The EVI2 values measured in crops aged 180 to 240 days in the rainy season proved to be the best strategy for classifying MZs by RS, where MZ A, for example, had EVI2 of 0.37, compared to MZ E, which had an EVI2 of 0.32.
中文翻译:
植被指数作为绘制甘蔗管理区图的工具
在精准农业中,采用管理区 (MZ) 是提高农业效率的最有效策略之一。目前,甘蔗产区的MZ是根据传统的土壤采样进行分类的,这需要大量的时间、人力和财力资源。遥感 (RS) 与植被指数 (VI) 相结合是支持传统分类方法的有前途的替代方法,特别是因为它不需要物理访问感兴趣的区域,具有成本效益且劳动强度较低,并且可以快速并且容易覆盖大面积。本研究的目的是评估归一化差异植被指数(NDVI)和双波段增强植被指数(EVI2)对甘蔗MZ进行分类的能力,与传统方法相比,在巴西塞拉多生物群落(萨凡纳),巴西约有一半的甘蔗生产在这里。本研究使用了三个农业年(2015 年至 2018 年)中 5,500 个生产田的历史作物生产数据以及 2015 年至 2018 年 Landsat 8 卫星在 Google 地球引擎 (GEE) 中获取的 14 幅图像的 NDVI 和 EVI2 值。尽管仍有必要和鼓励改进,但本研究提出了一种根据 VI 对 MZ 进行分类的新方法。NDVI 与使用常规方法分类的 MZ 不相关,而 EVI2 对 MZ 之间的生物量变化更敏感,因此可以更好地区分 MZ。在雨季在 180 至 240 天的作物中测量的 EVI2 值被证明是通过 RS 对 MZ 进行分类的最佳策略,其中 MZ A,例如,


 京公网安备 11010802027423号