European Journal of Epidemiology ( IF 7.7 ) Pub Date : 2022-06-23 , DOI: 10.1007/s10654-022-00885-2 Philip M Clarke 1, 2 , An Tran-Duy 2 , Laurence S J Roope 1 , Jay A Stiles 2 , Adrian G Barnett 3
|
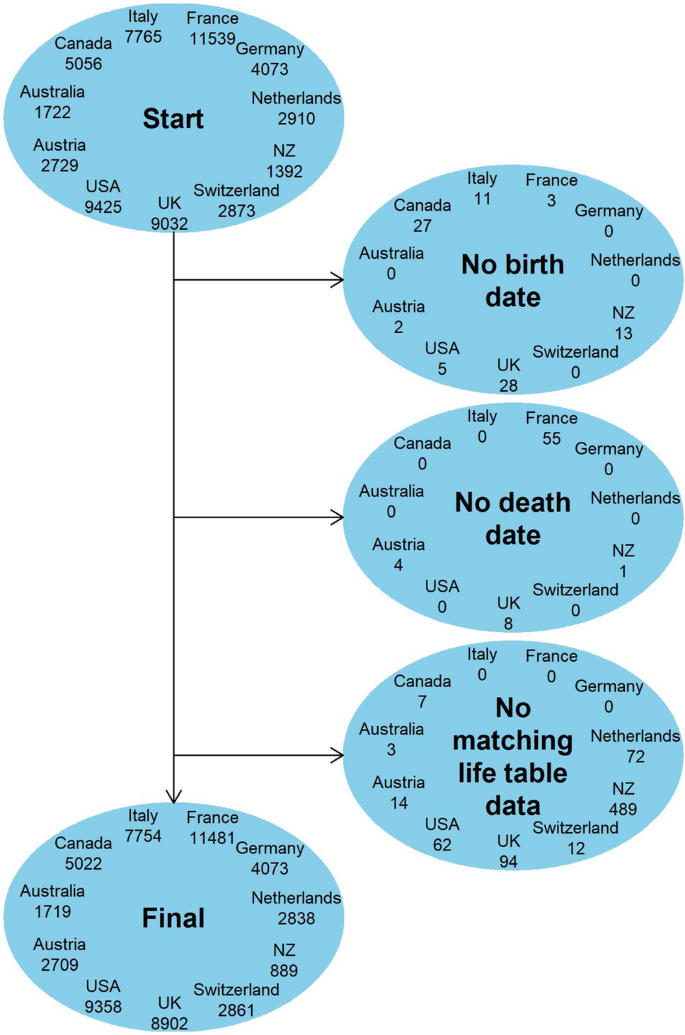
This study aims to compare the mortality rate and life expectancy of politicians with those of the age and gender-matched general populations. This was an observational analysis of mortality rates of politicians (i.e. members of national parliaments with available data on dates of birth, death and election, gender, and life tables) in 11 developed countries. Politicians were followed from date of first election until either death or the last available year with life table data. Relative mortality differences were estimated using standardised mortality ratios (SMRs). Absolute inequalities were quantified as the difference in survival by deducting a population’s remaining life expectancy from politicians’ remaining life expectancy at age 45, estimated using Gompertz parametric proportional hazards models. We included 57,561 politicians (with follow-up ranging from 1816–2016 for France to 1949–2017 for Germany). In almost all countries politicians had similar rates of mortality to the general population in the early part of the twentieth century. Relative mortality and survival differences (favouring politicians) increased considerably over the course of the twentieth century, with recent SMRs ranging from 0.45 (95%CI 0.41–0.50) in Italy to 0.82 (95%CI 0.69–0.95) in New Zealand. The peak life expectancy gaps ranged from 4.4 (95% CI, 3.5–5.4) years in the Netherlands to 7.8 (95% CI, 7.2–8.4) years in the US. Our results show large relative and absolute inequalities favouring politicians in every country. In some countries, such as the US, relative inequalities are at the greatest level in over 150 years.
中文翻译:
长期历史中精英群体的相对死亡率:对 11 个国家的政治家的观察分析
本研究旨在比较政治家与年龄和性别匹配的一般人群的死亡率和预期寿命。这是对 11 个发达国家的政治家(即拥有关于出生日期、死亡和选举、性别和寿命表的可用数据的国家议会成员)死亡率的观察性分析。政客们从第一次选举之日起被跟踪,直到死亡或最后一年有生命表数据。使用标准化死亡率(SMR)估计相对死亡率差异。通过从政治家在 45 岁时的剩余预期寿命中扣除人口的剩余预期寿命,将绝对不平等量化为生存差异,使用 Gompertz 参数比例风险模型进行估计。我们包括 57 个,561 位政治家(法国从 1816-2016 年到德国从 1949-2017 年跟进)。在 20 世纪初期,几乎所有国家的政治家的死亡率都与普通民众相似。相对死亡率和生存率差异(有利于政治家)在 20 世纪显着增加,最近的 SMR 范围从意大利的 0.45 (95%CI 0.41–0.50) 到新西兰的 0.82 (95%CI 0.69–0.95)。预期寿命峰值差距从荷兰的 4.4 (95% CI, 3.5–5.4) 年到美国的 7.8 (95% CI, 7.2–8.4) 年不等。我们的结果表明,每个国家的政治家都存在着巨大的相对和绝对不平等。在美国等一些国家,相对不平等程度达到了 150 多年来的最高水平。在 20 世纪初期,几乎所有国家的政治家的死亡率都与普通民众相似。相对死亡率和生存率差异(有利于政治家)在 20 世纪显着增加,最近的 SMR 范围从意大利的 0.45 (95%CI 0.41–0.50) 到新西兰的 0.82 (95%CI 0.69–0.95)。预期寿命峰值差距从荷兰的 4.4 (95% CI, 3.5–5.4) 年到美国的 7.8 (95% CI, 7.2–8.4) 年不等。我们的结果表明,每个国家的政治家都存在着巨大的相对和绝对不平等。在美国等一些国家,相对不平等程度达到了 150 多年来的最高水平。在 20 世纪初期,几乎所有国家的政治家的死亡率都与普通民众相似。相对死亡率和生存率差异(有利于政治家)在 20 世纪显着增加,最近的 SMR 范围从意大利的 0.45 (95%CI 0.41–0.50) 到新西兰的 0.82 (95%CI 0.69–0.95)。预期寿命峰值差距从荷兰的 4.4 (95% CI, 3.5–5.4) 年到美国的 7.8 (95% CI, 7.2–8.4) 年不等。我们的结果表明,每个国家的政治家都存在着巨大的相对和绝对不平等。在美国等一些国家,相对不平等程度达到了 150 多年来的最高水平。相对死亡率和生存率差异(有利于政治家)在 20 世纪显着增加,最近的 SMR 范围从意大利的 0.45 (95%CI 0.41–0.50) 到新西兰的 0.82 (95%CI 0.69–0.95)。预期寿命峰值差距从荷兰的 4.4 (95% CI, 3.5–5.4) 年到美国的 7.8 (95% CI, 7.2–8.4) 年不等。我们的结果表明,每个国家的政治家都存在着巨大的相对和绝对不平等。在美国等一些国家,相对不平等程度达到了 150 多年来的最高水平。相对死亡率和生存率差异(有利于政治家)在 20 世纪显着增加,最近的 SMR 范围从意大利的 0.45 (95%CI 0.41–0.50) 到新西兰的 0.82 (95%CI 0.69–0.95)。预期寿命峰值差距从荷兰的 4.4 (95% CI, 3.5–5.4) 年到美国的 7.8 (95% CI, 7.2–8.4) 年不等。我们的结果表明,每个国家的政治家都存在着巨大的相对和绝对不平等。在美国等一些国家,相对不平等程度达到了 150 多年来的最高水平。4) 年在荷兰到 7.8 (95% CI, 7.2–8.4) 年在美国。我们的结果表明,每个国家的政治家都存在着巨大的相对和绝对不平等。在美国等一些国家,相对不平等程度达到了 150 多年来的最高水平。4) 年在荷兰到 7.8 (95% CI, 7.2–8.4) 年在美国。我们的结果表明,每个国家的政治家都存在着巨大的相对和绝对不平等。在美国等一些国家,相对不平等程度达到了 150 多年来的最高水平。


 京公网安备 11010802027423号