European Journal of Nuclear Medicine and Molecular Imaging ( IF 9.1 ) Pub Date : 2022-06-18 , DOI: 10.1007/s00259-022-05867-w Neda Zaker 1, 2 , Kamal Haddad 2 , Reza Faghihi 2 , Hossein Arabi 1 , Habib Zaidi 1, 3, 4, 5
|
Purpose
This study proposed and investigated the feasibility of estimating Patlak-derived influx rate constant (Ki) from standardized uptake value (SUV) and/or dynamic PET image series.
Methods
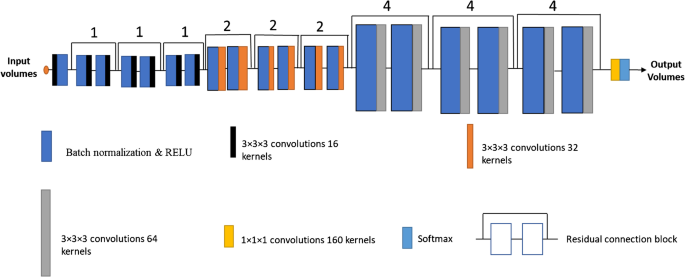
Whole-body 18F-FDG dynamic PET images of 19 subjects consisting of 13 frames or passes were employed for training a residual deep learning model with SUV and/or dynamic series as input and Ki-Patlak (slope) images as output. The training and evaluation were performed using a nine-fold cross-validation scheme. Owing to the availability of SUV images acquired 60 min post-injection (20 min total acquisition time), the data sets used for the training of the models were split into two groups: “With SUV” and “Without SUV.” For “With SUV” group, the model was first trained using only SUV images and then the passes (starting from pass 13, the last pass, to pass 9) were added to the training of the model (one pass each time). For this group, 6 models were developed with input data consisting of SUV, SUV plus pass 13, SUV plus passes 13 and 12, SUV plus passes 13 to 11, SUV plus passes 13 to 10, and SUV plus passes 13 to 9. For the “Without SUV” group, the same trend was followed, but without using the SUV images (5 models were developed with input data of passes 13 to 9). For model performance evaluation, the mean absolute error (MAE), mean error (ME), mean relative absolute error (MRAE%), relative error (RE%), mean squared error (MSE), root mean squared error (RMSE), peak signal-to-noise ratio (PSNR), and structural similarity index (SSIM) were calculated between the predicted Ki-Patlak images by the two groups and the reference Ki-Patlak images generated through Patlak analysis using the whole acquired data sets. For specific evaluation of the method, regions of interest (ROIs) were drawn on representative organs, including the lung, liver, brain, and heart and around the identified malignant lesions.
Results
The MRAE%, RE%, PSNR, and SSIM indices across all patients were estimated as 7.45 ± 0.94%, 4.54 ± 2.93%, 46.89 ± 2.93, and 1.00 ± 6.7 × 10⁻⁷, respectively, for models predicted using SUV plus passes 13 to 9 as input. The predicted parameters using passes 13 to 11 as input exhibited almost similar results compared to the predicted models using SUV plus passes 13 to 9 as input. Yet, the bias was continuously reduced by adding passes until pass 11, after which the magnitude of error reduction was negligible. Hence, the predicted model with SUV plus passes 13 to 9 had the lowest quantification bias. Lesions invisible in one or both of SUV and Ki-Patlak images appeared similarly through visual inspection in the predicted images with tolerable bias.
Conclusion
This study concluded the feasibility of direct deep learning-based approach to estimate Ki-Patlak parametric maps without requiring the input function and with a fewer number of passes. This would lead to shorter acquisition times for WB dynamic imaging with acceptable bias and comparable lesion detectability performance.
中文翻译:
使用卷积神经网络在全身 PET/CT 成像中直接推断 Patlak 参数图像
目的
本研究提出并调查了从标准化摄取值 (SUV) 和/或动态 PET 图像系列估计 Patlak 派生的流入率常数 ( K i ) 的可行性。
方法
19 名受试者的全身18F -FDG 动态 PET 图像由 13 帧或遍组成,用于训练以 SUV 和/或动态系列作为输入和K i的残差深度学习模型-Patlak(斜率)图像作为输出。使用九折交叉验证方案进行训练和评估。由于在注射后 60 分钟(总采集时间为 20 分钟)获得 SUV 图像的可用性,用于模型训练的数据集分为两组:“有 SUV”和“无 SUV”。对于“With SUV”组,模型首先仅使用 SUV 图像进行训练,然后将通道(从通道 13,最后一个通道开始,到通道 9)添加到模型的训练中(每次一个通道)。对于该组,开发了 6 种模型,其输入数据包括 SUV、SUV 加上 pass 13、SUV 加上 pass 13 和 12、SUV 加上 pass 13 到 11、SUV 加上 pass 13 到 10 以及 SUV 加上 pass 13 到 9。对于“没有SUV”组,同样的趋势,但没有使用 SUV 图像(5 个模型是使用第 13 到 9 遍的输入数据开发的)。对于模型性能评估,平均绝对误差(MAE)、平均误差(ME)、平均相对绝对误差(MRAE%)、相对误差(RE%)、均方误差(MSE)、均方根误差(RMSE)、计算预测值之间的峰值信噪比 (PSNR) 和结构相似性指数 (SSIM)两组的 K i -Patlak 图像和使用整个采集数据集通过 Patlak 分析生成的参考K i -Patlak图像。为了对该方法进行具体评估,在代表性器官(包括肺、肝、脑和心脏)以及已识别的恶性病变周围绘制感兴趣区域 (ROI)。
结果
对于使用 SUV plus passes 预测的模型,所有患者的 MRAE%、RE%、PSNR 和 SSIM 指数分别估计为 7.45 ± 0.94%、4.54 ± 2.93%、46.89 ± 2.93 和 1.00 ± 6.7 × 10 -7 13 到 9 作为输入。与使用 SUV 加上第 13 到 9 次作为输入的预测模型相比,使用第 13 到 11 次作为输入的预测参数显示出几乎相似的结果。然而,通过添加遍数直到第 11 遍,偏差不断减少,之后误差减少的幅度可以忽略不计。因此,具有 SUV 加上第 13 到 9 次传递的预测模型具有最低的量化偏差。在 SUV 和K i -Patlak 图像中的一个或两个图像中不可见的病变通过目视检查在具有可容忍偏差的预测图像中类似地出现。
结论
本研究总结了直接基于深度学习的方法估计K i -Patlak 参数映射的可行性,而无需输入函数且传递次数较少。这将导致更短的 WB 动态成像采集时间,具有可接受的偏差和可比较的病变检测性能。


 京公网安备 11010802027423号