Statistical Papers ( IF 1.2 ) Pub Date : 2022-05-25 , DOI: 10.1007/s00362-022-01322-y Janet Aisbett , Eric J. Drinkwater , Kenneth L. Quarrie , Stephen Woodcock
|
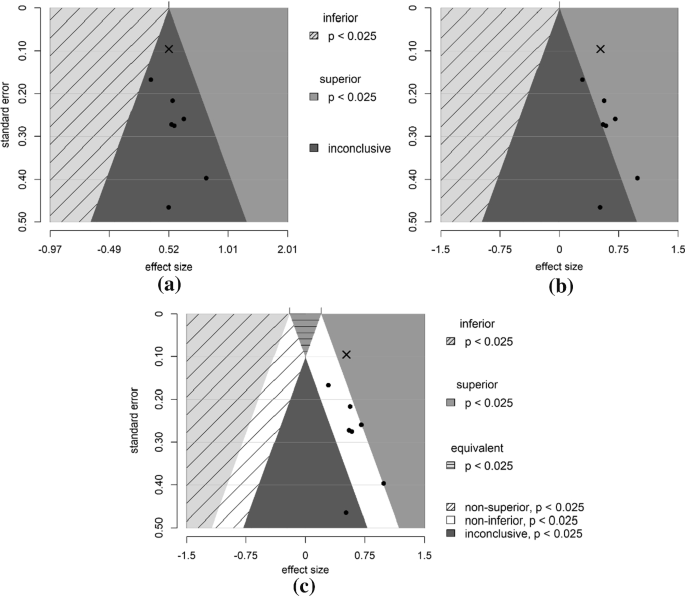
Researchers across many fields routinely analyze trial data using Null Hypothesis Significance Tests with zero null and p < 0.05. To promote thoughtful statistical testing, we propose a visualization tool that highlights practically meaningful effects when calculating sample sizes. The tool re-purposes and adapts funnel plots, originally developed for meta-analyses, after generalizing them to cater for meaningful effects. As with traditional sample size calculators, researchers must nominate anticipated effect sizes and variability alongside the desired power. The advantage of our tool is that it simultaneously presents sample sizes needed to adequately power tests for equivalence, for non-inferiority and for superiority, each considered at up to three alpha levels and in positive and negative directions. The tool thus encourages researchers at the design stage to think about the type and level of test in terms of their research goals, costs of errors, meaningful effect sizes and feasible sample sizes. An R-implementation of the tool is available on-line.
中文翻译:
应用广义漏斗图来帮助设计统计分析
许多领域的研究人员经常使用零假设显着性检验分析试验数据,零零和 p < 0.05。为了促进深思熟虑的统计测试,我们提出了一种可视化工具,可以在计算样本量时突出显示实际有意义的效果。该工具重新利用并调整了最初为荟萃分析而开发的漏斗图,然后对其进行概括以适应有意义的影响。与传统的样本量计算器一样,研究人员必须指定预期的效应量和可变性以及所需的功效。我们工具的优势在于,它同时提供了充分检验等效性、非劣效性和优越性所需的样本量,每个测试都在多达三个 alpha 水平和正负方向上考虑。因此,该工具鼓励研究人员在设计阶段根据他们的研究目标、错误成本、有意义的影响大小和可行的样本大小来考虑测试的类型和水平。该工具的 R 实现可在线获得。


 京公网安备 11010802027423号