Agricultural Systems ( IF 6.1 ) Pub Date : 2022-03-14 , DOI: 10.1016/j.agsy.2022.103402 Benjamin Nowak 1 , Audrey Michaud 2 , Gaëlle Marliac 3
|
CONTEXT
More diversified crop rotations are a key factor in reducing weed, disease and pest pressure while reducing the use of phytosanitary products. The increase in available data calls for the development of new methods and indicators to characterize crop rotations.
OBJECTIVES
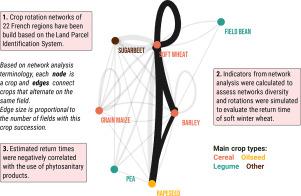
This paper presents an application of network analysis to assess the diversity of crop rotations from the Land Parcel Identification System, which now provides field boundaries and type of crops grown in a given year for farmers receiving subsidies from the European Common Agricultural Policy. Different indicators are presented to compare the diversity of crop rotations for the 22 regions of mainland France (corresponding to the boundaries of former administrative regions) and the influence of some methodological choices are discussed.
METHODS
Using LPIS data, previous-following crop pairs have been identified for two thirds of the French fields for three crop successions (from 2017 to 2018, from 2018 to 2019 and from 2019 to 2020). These data were used to build crop rotation networks for each region. Crop rotations were simulated from those networks in order to estimate the return time of soft winter wheat, which is the most cultivated crop in the country.
RESULTS AND CONCLUSION
Crop rotation networks were similar between the three crop successions compared, but differed among regions. Ignoring the most uncommon previous-following crop pairs, the mean number of precedents per crop ranged from three to nine depending on the region. The estimated return times for winter wheat increase when taking into account grasslands in crop rotation networks, but in any case the use of phytosanitary products was negatively correlated with the return time.
SIGNIFICANCE
The methodology developed in this article provides some initial guidelines for developing relevant agronomic indicators from crop rotation network analysis. It has been shown that the estimated return time could be an indicator of the intensity of use of phytosanitary products, and could therefore be used to guide public policies aimed at reducing the use of these products.
中文翻译:
基于网络分析指标的轮作多样性评估
语境
更多样化的轮作是减少杂草、病虫害压力同时减少植物检疫产品使用的关键因素。可用数据的增加要求开发新的方法和指标来表征作物轮作。
目标
本文介绍了网络分析的应用,以评估地块识别系统中作物轮作的多样性,该系统现在为接受欧洲共同农业政策补贴的农民提供田间边界和特定年份种植的作物类型。提出了不同的指标来比较法国大陆22个地区(对应于原行政区域的边界)的轮作多样性,并讨论了一些方法选择的影响。
方法
使用 LPIS 数据,三分之二的法国农田已经确定了三个作物连续(2017 年至 2018 年、2018 年至 2019 年和 2019 年至 2020 年)的先前作物对。这些数据用于为每个地区建立轮作网络。从这些网络模拟作物轮作,以估计软冬小麦的返回时间,这是该国种植最多的作物。
结果与结论
比较的三种作物轮作之间的作物轮作网络相似,但不同地区之间存在差异。忽略最不常见的前后作物对,每种作物的平均先例数量从三到九不等,具体取决于地区。考虑到作物轮作网络中的草地,冬小麦的估计返回时间会增加,但无论如何,植物检疫产品的使用与返回时间呈负相关。
意义
本文开发的方法为从轮作网络分析中开发相关农艺指标提供了一些初步指南。已经表明,估计的返回时间可以作为植物检疫产品使用强度的指标,因此可以用来指导旨在减少这些产品使用的公共政策。


 京公网安备 11010802027423号