European Journal of Agronomy ( IF 4.5 ) Pub Date : 2022-03-09 , DOI: 10.1016/j.eja.2022.126489 Rafael Rodrigues de Souza , Marcos Toebe , Volmir Sergio Marchioro , Alberto Cargnelutti Filho , Alessandro Dal’Col Lúcio , Giovani Benin , Anderson Chuquel Mello , Francieli de Lima Tartaglia , Guilherme Liberalesso Manfio
|
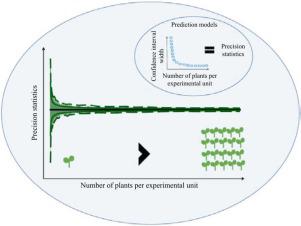
Empirical decision-making on the number of plants to be sampled per experimental unit when assessing soybean grain yield is a commonly observed situation. The cause for this is unknowing how that decision affects experimental precision statistics, which has not yet been reported. Therefore, the aims of this study were: to analyze the response of experimental precision statistics as a function of the variations in the number of plants collected per experimental unit in highland and lowland systems; to define the optimal sample size per experimental unit for each precision statistic; and, to propose predictive models for estimating the precision of experiments with soybean. Field experiments were carried out in two locations of Rio Grande do Sul, Brazil, using 30 cultivars in the highland trials and 20 cultivars in the lowland trials. A validation trial was also performed using 8 cultivars. A randomized block design with three repetitions was used for all trials. The grain yield of 20 plants per experimental unit was assessed, thus totaling 9000 plants. In the validation experiment, grain yield was measured in 100 plants per experimental unit, totaling 2400 plants more. From these experiments, trials with sample scenarios of 1, 2, …, 1000 plants per experimental unit were simulated with replacement. The confidence interval width of the precision statistics reduced as the number of plants measured per experimental unit increased, allowing a higher precision of its estimates. In general, up from values of ≥ 70%, precision gain, in the estimates of experimental precision statistic determined in soybean highland and lowland systems, tends to stabilize. The optimal sample number per experimental unit varied between systems and experimental precision statistics. The sampling of 18 plants per experimental unit is sufficient to estimate most precision indicators reliably. Interestingly, the mechanistic response of the confidence interval width is easily modeled and can be used for predicting experimental precision in highland and lowland cropping systems. From this analysis, a methodology for predicting experimental precision was outlined based on sample size per experimental unit, thus bringing new insight into future experimental planning for soybean experiments in highland and lowland systems in subtropical climate.
中文翻译:
亚热带气候下单株大豆产量变异性:用于精确统计的样本量定义和预测模型
在评估大豆籽粒产量时,对每个实验单位采样的植物数量进行经验决策是一种常见的情况。造成这种情况的原因是不知道该决定如何影响尚未报告的实验精度统计数据。因此,本研究的目的是:分析实验精度统计的响应,作为高地和低地系统中每个实验单元收集的植物数量变化的函数;为每个精度统计定义每个实验单元的最佳样本量;并且,提出用于估计大豆实验精度的预测模型。在巴西南里奥格兰德州的两个地点进行了田间试验,在高地试验中使用了 30 个品种,在低地试验中使用了 20 个品种。还使用 8 个品种进行了验证试验。所有试验均采用具有 3 次重复的随机区组设计。每个实验单位评估了 20 株的谷物产量,因此总计 9000 株。在验证实验中,每个实验单元测量了 100 株的谷物产量,总计 2400 株以上。从这些实验中,对每个实验单元 1、2、...、1000 株植物的样本场景进行了替换模拟试验。随着每个实验单位测量的植物数量的增加,精度统计的置信区间宽度减小,从而允许更高的估计精度。一般来说,从 ≥ 70% 的值开始,在大豆高地和低地系统确定的实验精度统计估计值中,精度增益趋于稳定。每个实验单元的最佳样本数因系统和实验精度统计而异。每个实验单元 18 株植物的抽样足以可靠地估计大多数精度指标。有趣的是,置信区间宽度的机械响应很容易建模,可用于预测高地和低地种植系统的实验精度。从该分析中,概述了基于每个实验单元的样本量预测实验精度的方法,从而带来了新的 置信区间宽度的机械响应易于建模,可用于预测高地和低地种植系统的实验精度。从该分析中,概述了基于每个实验单元的样本量预测实验精度的方法,从而带来了新的 置信区间宽度的机械响应易于建模,可用于预测高地和低地种植系统的实验精度。从该分析中,概述了基于每个实验单元的样本量预测实验精度的方法,从而带来了新的深入了解亚热带气候高地和低地系统大豆试验的未来试验计划。


 京公网安备 11010802027423号