Diabetologia ( IF 8.2 ) Pub Date : 2022-01-15 , DOI: 10.1007/s00125-021-05640-y Katarzyna Dziopa 1 , Folkert W Asselbergs 1, 2, 3 , Jasmine Gratton 2 , Nishi Chaturvedi 2, 4 , Amand F Schmidt 2, 3
|
Aims/hypothesis
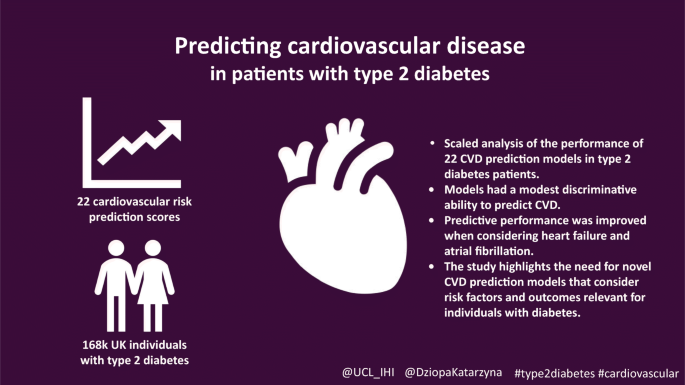
We aimed to compare the performance of risk prediction scores for CVD (i.e., coronary heart disease and stroke), and a broader definition of CVD including atrial fibrillation and heart failure (CVD+), in individuals with type 2 diabetes.
Methods
Scores were identified through a literature review and were included irrespective of the type of predicted cardiovascular outcome or the inclusion of individuals with type 2 diabetes. Performance was assessed in a contemporary, representative sample of 168,871 UK-based individuals with type 2 diabetes (age ≥18 years without pre-existing CVD+). Missing observations were addressed using multiple imputation.
Results
We evaluated 22 scores: 13 derived in the general population and nine in individuals with type 2 diabetes. The Systemic Coronary Risk Evaluation (SCORE) CVD rule derived in the general population performed best for both CVD (C statistic 0.67 [95% CI 0.67, 0.67]) and CVD+ (C statistic 0.69 [95% CI 0.69, 0.70]). The C statistic of the remaining scores ranged from 0.62 to 0.67 for CVD, and from 0.64 to 0.69 for CVD+. Calibration slopes (1 indicates perfect calibration) ranged from 0.38 (95% CI 0.37, 0.39) to 0.74 (95% CI 0.72, 0.76) for CVD, and from 0.41 (95% CI 0.40, 0.42) to 0.88 (95% CI 0.86, 0.90) for CVD+. A simple recalibration process considerably improved the performance of the scores, with calibration slopes now ranging between 0.96 and 1.04 for CVD. Scores with more predictors did not outperform scores with fewer predictors: for CVD+, QRISK3 (19 variables) had a C statistic of 0.68 (95% CI 0.68, 0.69), compared with SCORE CVD (six variables) which had a C statistic of 0.69 (95% CI 0.69, 0.70). Scores specific to individuals with diabetes did not discriminate better than scores derived in the general population: the UK Prospective Diabetes Study (UKPDS) scores performed significantly worse than SCORE CVD (p value <0.001).
Conclusions/interpretation
CVD risk prediction scores could not accurately identify individuals with type 2 diabetes who experienced a CVD event in the 10 years of follow-up. All 22 evaluated models had a comparable and modest discriminative ability.
Graphical abstract
中文翻译:
2 型糖尿病的心血管风险预测:初级保健机构中 22 项风险评分的比较
目标/假设
我们的目的是比较 2 型糖尿病患者 CVD(即冠心病和中风)风险预测评分的表现,以及更广泛的 CVD 定义,包括心房颤动和心力衰竭 (CVD+)。
方法
评分是通过文献综述确定的,无论预测的心血管结果类型如何或是否包含 2 型糖尿病患者,都将其包括在内。对 168,871 名英国 2 型糖尿病患者(年龄≥18 岁,既往无 CVD+)的当代代表性样本进行了性能评估。使用多重插补处理缺失的观察结果。
结果
我们评估了 22 个分数:13 个来自普通人群,9 个来自 2 型糖尿病患者。在普通人群中得出的系统性冠状动脉风险评估 (SCORE) CVD 规则对 CVD(C 统计量 0.67 [95% CI 0.67, 0.67])和 CVD+(C 统计量 0.69 [95% CI 0.69, 0.70])表现最佳。CVD 的其余分数的 C 统计量范围为 0.62 至 0.67,CVD+ 的 C 统计量范围为 0.64 至 0.69。CVD 的校准斜率(1 表示完美校准)范围为 0.38 (95% CI 0.37, 0.39) 至 0.74 (95% CI 0.72, 0.76),以及 0.41 (95% CI 0.40, 0.42) 至 0.88 (95% CI 0.86) , 0.90) 对于 CVD+。一个简单的重新校准过程大大提高了分数的性能,CVD 的校准斜率现在介于 0.96 和 1.04 之间。预测因子较多的分数并不优于预测因子较少的分数:对于 CVD+,QRISK3(19 个变量)的 C 统计量为 0.68(95% CI 0.68,0.69),而 SCORE CVD(6 个变量)的 C 统计量为 0.69(95% CI 0.69,0.70)。特定于糖尿病患者的评分并没有比一般人群的评分更好地区分:英国前瞻性糖尿病研究 (UKPDS) 评分的表现明显差于 SCORE CVD(p 值 <0.001)。
结论/解释
CVD 风险预测评分无法准确识别在 10 年随访中经历过 CVD 事件的 2 型糖尿病患者。所有 22 个评估模型都具有可比较且适度的判别能力。


 京公网安备 11010802027423号