JACC: Cardiovascular Imaging ( IF 12.8 ) Pub Date : 2021-11-17 , DOI: 10.1016/j.jcmg.2021.09.018 Omar Dzaye 1 , Alexander C Razavi 2 , Zeina A Dardari 1 , Daniel S Berman 3 , Matthew J Budoff 4 , Michael D Miedema 5 , Olufunmilayo H Obisesan 1 , Ellen Boakye 1 , Khurram Nasir 6 , Alan Rozanski 7 , John A Rumberger 8 , Leslee J Shaw 9 , Martin Bødtker Mortensen 10 , Seamus P Whelton 1 , Michael J Blaha 1
|
Objectives
This study sought to assess the relationship between mean vs peak calcified plaque density and their impact on calculating coronary artery calcium (CAC) scores and to compare the corresponding differential prediction of atherosclerotic cardiovascular disease (ASCVD) and coronary heart disease (CHD) mortality.
Background
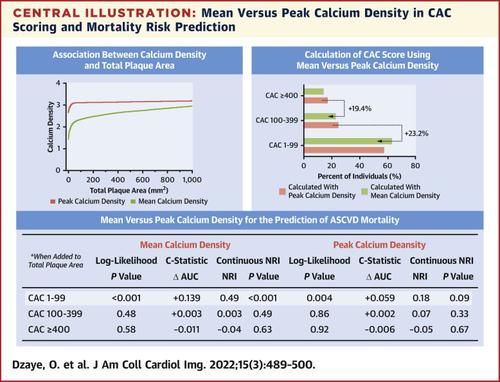
The Agatston CAC score is quantified per lesion as the product of plaque area and a 4-level categorical peak calcium density factor. However, mean calcium density may more accurately measure the heterogenous mixture of lipid-rich, fibrous, and calcified plaque reflective of ASCVD risk.
Methods
We included 10,373 individuals from the CAC Consortium who had CAC >0 and per-vessel measurements of peak calcium density factor and mean calcium density. Area under the curve and continuous net reclassification improvement analyses were performed for CHD and ASCVD mortality to compare the predictive abilities of mean calcium density vs peak calcium density factor when calculating the Agatston CAC score.
Results
Participants were on average 53.4 years of age, 24.4% were women, and the median CAC score was 68 Agatston units. The average values for mean calcium density and peak calcium density factor were 210 ± 50 HU and 3.1 ± 0.5, respectively. Individuals younger than 50 years of age and/or those with a total plaque area <100 mm2 had the largest differences between the peak and mean density measures. Among persons with CAC 1-99, the use of mean calcium density resulted in a larger improvement in ASCVD mortality net reclassification improvement (NRI) (NRI = 0.49; P < 0.001 vs. NRI = 0.18; P = 0.08) and CHD mortality discrimination (Δ area under the curve (AUC) = +0.169 vs +0.036; P < 0.001) compared with peak calcium density factor. Neither peak nor mean calcium density improved mortality prediction at CAC scores >100.
Conclusion
Mean and peak calcium density may differentially describe plaque composition early in the atherosclerotic process. Mean calcium density performs better than peak calcium density factor when combined with plaque area for ASCVD mortality prediction among persons with Agatston CAC 1-99.
中文翻译:
非造影 CT 上的平均冠状动脉钙密度与峰值冠状动脉钙密度
目标
本研究旨在评估平均钙化斑块密度与峰值钙化斑块密度之间的关系及其对计算冠状动脉钙化(CAC)评分的影响,并比较动脉粥样硬化性心血管疾病(ASCVD)和冠心病(CHD)死亡率的相应差异预测。
背景
Agatston CAC 评分根据斑块面积和 4 级分类峰值钙密度因子的乘积对每个病变进行量化。然而,平均钙密度可以更准确地测量反映 ASCVD 风险的富含脂质、纤维和钙化斑块的异质混合物。
方法
我们纳入了来自 CAC 联盟的 10,373 名个人,他们的 CAC > 0 和每血管的峰值钙密度因子和平均钙密度测量值。对 CHD 和 ASCVD 死亡率进行曲线下面积和连续净重分类改善分析,以比较计算 Agatston CAC 评分时平均钙密度与峰值钙密度因子的预测能力。
结果
参与者平均年龄 53.4 岁,其中 24.4% 为女性,CAC 评分中位数为 68 Agatston 单位。平均钙密度和峰值钙密度因子的平均值分别为 210 ± 50 HU 和 3.1 ± 0.5。年龄小于 50 岁的个体和/或斑块总面积<100 id=22>2 的个体在峰值和平均密度测量之间具有最大差异。在 CAC 1-99 患者中,使用平均钙密度可显着改善 ASCVD 死亡率净重分类改善 (NRI)(NRI = 0.49; P < 0.001 对比 NRI = 0.18; P = 0.08)和 CHD 死亡率歧视(Δ 曲线下面积 (AUC) = +0.169 与 +0.036; P < 0.001)与峰值钙密度因子相比。当 CAC 分数 > 100 时,峰值钙密度和平均钙密度均不能改善死亡率预测。
结论
平均和峰值钙密度可能不同地描述了动脉粥样硬化过程早期的斑块成分。当与斑块面积相结合来预测 Agatston CAC 1-99 患者的 ASCVD 死亡率时,平均钙密度比峰值钙密度因子表现更好。


 京公网安备 11010802027423号