当前位置:
X-MOL 学术
›
Am. J. Primatol.
›
论文详情
Our official English website, www.x-mol.net, welcomes your feedback! (Note: you will need to create a separate account there.)
Range-wide indicators of African great ape density distribution
American Journal of Primatology ( IF 2.4 ) Pub Date : 2021-10-18 , DOI: 10.1002/ajp.23338 Isabel Ordaz-Németh 1 , Tenekwetche Sop 1 , Bala Amarasekaran 2 , Mona Bachmann 1 , Christophe Boesch 1, 3 , Terry Brncic 4 , Damien Caillaud 5, 6 , Geneviève Campbell 7 , Joana Carvalho 8 , Rebecca Chancellor 9 , Tim R B Davenport 4 , Dervla Dowd 3 , Manasseh Eno-Nku 10 , Jessica Ganas-Swaray 11 , Nicholas Granier 12 , Elizabeth Greengrass 13 , Stefanie Heinicke 1, 14, 15 , Ilka Herbinger 16 , Clement Inkamba-Nkulu 4 , Fortuné Iyenguet 4 , Jessica Junker 14 , Kadiri S Bobo 17 , Alain Lushimba 18 , Fiona Maisels 4, 8 , Guy Aimé Florent Malanda 19 , Maureen S McCarthy 1 , Prosper Motsaba 4 , Jennifer Moustgaard 20 , Mizuki Murai 1 , Bezangoye Ndokoue 4 , Stuart Nixon 21 , Rostand Aba'a Nseme 22 , Zacharie Nzooh 10 , Lilian Pintea 23 , Andrew J Plumptre 24 , Justin Roy 1 , Aaron Rundus 25 , Jim Sanderson 26 , Adeline Serckx 1, 7, 27 , Samantha Strindberg 4 , Clement Tweh 3, 28 , Hilde Vanleeuwe 4 , Ashley Vosper 29 , Matthias Waltert 30 , Elizabeth A Williamson 8 , Michael Wilson 31 , Roger Mundry 1, 32 , Hjalmar S Kühl 1, 14
American Journal of Primatology ( IF 2.4 ) Pub Date : 2021-10-18 , DOI: 10.1002/ajp.23338 Isabel Ordaz-Németh 1 , Tenekwetche Sop 1 , Bala Amarasekaran 2 , Mona Bachmann 1 , Christophe Boesch 1, 3 , Terry Brncic 4 , Damien Caillaud 5, 6 , Geneviève Campbell 7 , Joana Carvalho 8 , Rebecca Chancellor 9 , Tim R B Davenport 4 , Dervla Dowd 3 , Manasseh Eno-Nku 10 , Jessica Ganas-Swaray 11 , Nicholas Granier 12 , Elizabeth Greengrass 13 , Stefanie Heinicke 1, 14, 15 , Ilka Herbinger 16 , Clement Inkamba-Nkulu 4 , Fortuné Iyenguet 4 , Jessica Junker 14 , Kadiri S Bobo 17 , Alain Lushimba 18 , Fiona Maisels 4, 8 , Guy Aimé Florent Malanda 19 , Maureen S McCarthy 1 , Prosper Motsaba 4 , Jennifer Moustgaard 20 , Mizuki Murai 1 , Bezangoye Ndokoue 4 , Stuart Nixon 21 , Rostand Aba'a Nseme 22 , Zacharie Nzooh 10 , Lilian Pintea 23 , Andrew J Plumptre 24 , Justin Roy 1 , Aaron Rundus 25 , Jim Sanderson 26 , Adeline Serckx 1, 7, 27 , Samantha Strindberg 4 , Clement Tweh 3, 28 , Hilde Vanleeuwe 4 , Ashley Vosper 29 , Matthias Waltert 30 , Elizabeth A Williamson 8 , Michael Wilson 31 , Roger Mundry 1, 32 , Hjalmar S Kühl 1, 14
Affiliation
|
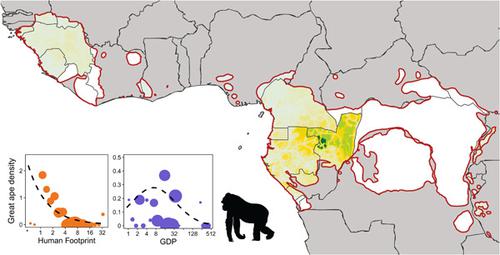
Species distributions are influenced by processes occurring at multiple spatial scales. It is therefore insufficient to model species distribution at a single geographic scale, as this does not provide the necessary understanding of determining factors. Instead, multiple approaches are needed, each differing in spatial extent, grain, and research objective. Here, we present the first attempt to model continent-wide great ape density distribution. We used site-level estimates of African great ape abundance to (1) identify socioeconomic and environmental factors that drive densities at the continental scale, and (2) predict range-wide great ape density. We collated great ape abundance estimates from 156 sites and defined 134 pseudo-absence sites to represent additional absence locations. The latter were based on locations of unsuitable environmental conditions for great apes, and on existing literature. We compiled seven socioeconomic and environmental covariate layers and fitted a generalized linear model to investigate their influence on great ape abundance. We used an Akaike-weighted average of full and subset models to predict the range-wide density distribution of African great apes for the year 2015. Great ape densities were lowest where there were high Human Footprint and Gross Domestic Product values; the highest predicted densities were in Central Africa, and the lowest in West Africa. Only 10.7% of the total predicted population was found in the International Union for Conservation of Nature Category I and II protected areas. For 16 out of 20 countries, our estimated abundances were largely in line with those from previous studies. For four countries, Central African Republic, Democratic Republic of the Congo, Liberia, and South Sudan, the estimated populations were excessively high. We propose further improvements to the model to overcome survey and predictor data limitations, which would enable a temporally dynamic approach for monitoring great apes across their range based on key indicators.
中文翻译:

非洲大猿密度分布的范围指标
物种分布受到在多个空间尺度上发生的过程的影响。因此,在单一地理尺度上模拟物种分布是不够的,因为这不能提供对决定因素的必要理解。相反,需要多种方法,每种方法的空间范围、粒度和研究目标都不同。在这里,我们首次尝试模拟整个大陆的类人猿密度分布。我们使用对非洲类人猿丰度的站点级估计来(1)确定驱动大陆尺度密度的社会经济和环境因素,以及(2)预测范围内的类人猿密度。我们整理了来自 156 个地点的类人猿丰度估计值,并定义了 134 个假缺席地点来代表其他缺席地点。后者是基于不适合类人猿的环境条件的位置,以及现有的文献。我们编制了七个社会经济和环境协变量层,并拟合了一个广义线性模型,以研究它们对类人猿丰度的影响。我们使用全模型和子模型的 Akaike 加权平均值来预测 2015 年非洲类人猿的全范围密度分布。在人类足迹和国内生产总值值较高的地方,类人猿的密度最低;预测密度最高的是中非,而西非最低。在国际自然保护联盟 I 类和 II 类保护区中仅发现 10.7% 的预测总人口。对于 20 个国家中的 16 个,我们估计的丰度与先前研究的丰度基本一致。中非共和国、刚果民主共和国、利比里亚和南苏丹这四个国家的人口估计过高。我们建议对模型进行进一步改进,以克服调查和预测数据的限制,这将使一种时间动态的方法能够根据关键指标在其范围内监测类人猿。
更新日期:2021-11-29
中文翻译:
非洲大猿密度分布的范围指标
物种分布受到在多个空间尺度上发生的过程的影响。因此,在单一地理尺度上模拟物种分布是不够的,因为这不能提供对决定因素的必要理解。相反,需要多种方法,每种方法的空间范围、粒度和研究目标都不同。在这里,我们首次尝试模拟整个大陆的类人猿密度分布。我们使用对非洲类人猿丰度的站点级估计来(1)确定驱动大陆尺度密度的社会经济和环境因素,以及(2)预测范围内的类人猿密度。我们整理了来自 156 个地点的类人猿丰度估计值,并定义了 134 个假缺席地点来代表其他缺席地点。后者是基于不适合类人猿的环境条件的位置,以及现有的文献。我们编制了七个社会经济和环境协变量层,并拟合了一个广义线性模型,以研究它们对类人猿丰度的影响。我们使用全模型和子模型的 Akaike 加权平均值来预测 2015 年非洲类人猿的全范围密度分布。在人类足迹和国内生产总值值较高的地方,类人猿的密度最低;预测密度最高的是中非,而西非最低。在国际自然保护联盟 I 类和 II 类保护区中仅发现 10.7% 的预测总人口。对于 20 个国家中的 16 个,我们估计的丰度与先前研究的丰度基本一致。中非共和国、刚果民主共和国、利比里亚和南苏丹这四个国家的人口估计过高。我们建议对模型进行进一步改进,以克服调查和预测数据的限制,这将使一种时间动态的方法能够根据关键指标在其范围内监测类人猿。


 京公网安备 11010802027423号