当前位置:
X-MOL 学术
›
Biotechnol. Bioeng.
›
论文详情
Our official English website, www.x-mol.net, welcomes your
feedback! (Note: you will need to create a separate account there.)
The yeastGemMap: A process diagram to assist yeast systems-metabolic studies
Biotechnology and Bioengineering ( IF 3.5 ) Pub Date : 2021-09-27 , DOI: 10.1002/bit.27943 Luis Caspeta 1 , Eduard J Kerkhoven 2, 3 , Alfredo Martinez 1 , Jens Nielsen 2, 3, 4
Biotechnology and Bioengineering ( IF 3.5 ) Pub Date : 2021-09-27 , DOI: 10.1002/bit.27943 Luis Caspeta 1 , Eduard J Kerkhoven 2, 3 , Alfredo Martinez 1 , Jens Nielsen 2, 3, 4
Affiliation
|
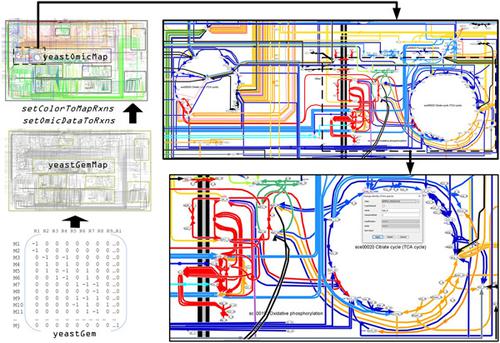
Visualization is a key aspect of the analysis of omics data. Although many tools can generate pathway maps for visualization of yeast metabolism, they fail in reconstructing genome-scale metabolic diagrams of compartmentalized metabolism. Here we report on the yeastGemMap, a process diagram of whole yeast metabolism created to assist data analysis in systems-metabolic studies. The map was manually reconstructed with reactions from a compartmentalized genome-scale metabolic model, based on biochemical process diagrams typically found in educational and specialized literature. The yeastGemMap consists of 3815 reactions representing 1150 genes, 2742 metabolites, and 14 compartments. Computational functions for adapting the graphical representation of the map are also reported. These functions modify the visual representation of the map to assist in three systems-metabolic tasks: illustrating reaction networks, interpreting metabolic flux data, and visualizing omics data. The versatility of the yeastGemMap and algorithms to assist visualization of systems-metabolic data was demonstrated in various tasks, including for single lethal reaction evaluation, flux balance analysis, and transcriptomic data analysis. For instance, visual interpretation of metabolic transcriptomes of thermally evolved and parental yeast strains allowed to demonstrate that evolved strains activate a preadaptation response at 30°C, which enabled thermotolerance. A quick interpretation of systems-metabolic data is promoted with yeastGemMap visualizations.
中文翻译:

酵母宝石图:协助酵母系统代谢研究的流程图
可视化是组学数据分析的一个关键方面。尽管许多工具可以生成酵母代谢可视化的途径图,但它们无法重建基因组规模的划分代谢的代谢图。在这里,我们报告了酵母GemMap,这是一个整个酵母代谢的流程图,用于协助系统代谢研究中的数据分析。该地图是根据通常在教育和专业文献中发现的生化过程图,通过划分的基因组规模代谢模型的反应手动重建的。酵母宝石图由 3815 个反应组成,代表 1150 个基因、2742 个代谢物和 14 个隔室。还报告了用于调整地图图形表示的计算函数。这些功能修改地图的可视化表示以协助完成三个系统代谢任务:说明反应网络、解释代谢通量数据和可视化组学数据。酵母GemMap 的多功能性和辅助系统代谢数据可视化的算法在各种任务中得到了证明,包括单一致死反应评估、通量平衡分析和转录组数据分析。例如,对热进化和亲本酵母菌株的代谢转录组的视觉解释可以证明进化菌株在 30°C 时激活预适应反应,从而实现耐热性。酵母GemMap 可视化促进了对系统代谢数据的快速解释。和可视化组学数据。酵母GemMap 的多功能性和辅助系统代谢数据可视化的算法在各种任务中得到了证明,包括单一致死反应评估、通量平衡分析和转录组数据分析。例如,对热进化和亲本酵母菌株的代谢转录组的视觉解释可以证明进化菌株在 30°C 时激活预适应反应,从而实现耐热性。酵母GemMap 可视化促进了对系统代谢数据的快速解释。和可视化组学数据。酵母GemMap 的多功能性和辅助系统代谢数据可视化的算法在各种任务中得到了证明,包括单一致死反应评估、通量平衡分析和转录组数据分析。例如,对热进化和亲本酵母菌株的代谢转录组的视觉解释可以证明进化菌株在 30°C 时激活预适应反应,从而实现耐热性。酵母GemMap 可视化促进了对系统代谢数据的快速解释。例如,对热进化和亲本酵母菌株的代谢转录组的视觉解释可以证明进化菌株在 30°C 时激活预适应反应,从而实现耐热性。酵母GemMap 可视化促进了对系统代谢数据的快速解释。例如,对热进化和亲本酵母菌株的代谢转录组的视觉解释可以证明进化菌株在 30°C 时激活预适应反应,从而实现耐热性。酵母GemMap 可视化促进了对系统代谢数据的快速解释。
更新日期:2021-11-10
中文翻译:
酵母宝石图:协助酵母系统代谢研究的流程图
可视化是组学数据分析的一个关键方面。尽管许多工具可以生成酵母代谢可视化的途径图,但它们无法重建基因组规模的划分代谢的代谢图。在这里,我们报告了酵母GemMap,这是一个整个酵母代谢的流程图,用于协助系统代谢研究中的数据分析。该地图是根据通常在教育和专业文献中发现的生化过程图,通过划分的基因组规模代谢模型的反应手动重建的。酵母宝石图由 3815 个反应组成,代表 1150 个基因、2742 个代谢物和 14 个隔室。还报告了用于调整地图图形表示的计算函数。这些功能修改地图的可视化表示以协助完成三个系统代谢任务:说明反应网络、解释代谢通量数据和可视化组学数据。酵母GemMap 的多功能性和辅助系统代谢数据可视化的算法在各种任务中得到了证明,包括单一致死反应评估、通量平衡分析和转录组数据分析。例如,对热进化和亲本酵母菌株的代谢转录组的视觉解释可以证明进化菌株在 30°C 时激活预适应反应,从而实现耐热性。酵母GemMap 可视化促进了对系统代谢数据的快速解释。和可视化组学数据。酵母GemMap 的多功能性和辅助系统代谢数据可视化的算法在各种任务中得到了证明,包括单一致死反应评估、通量平衡分析和转录组数据分析。例如,对热进化和亲本酵母菌株的代谢转录组的视觉解释可以证明进化菌株在 30°C 时激活预适应反应,从而实现耐热性。酵母GemMap 可视化促进了对系统代谢数据的快速解释。和可视化组学数据。酵母GemMap 的多功能性和辅助系统代谢数据可视化的算法在各种任务中得到了证明,包括单一致死反应评估、通量平衡分析和转录组数据分析。例如,对热进化和亲本酵母菌株的代谢转录组的视觉解释可以证明进化菌株在 30°C 时激活预适应反应,从而实现耐热性。酵母GemMap 可视化促进了对系统代谢数据的快速解释。例如,对热进化和亲本酵母菌株的代谢转录组的视觉解释可以证明进化菌株在 30°C 时激活预适应反应,从而实现耐热性。酵母GemMap 可视化促进了对系统代谢数据的快速解释。例如,对热进化和亲本酵母菌株的代谢转录组的视觉解释可以证明进化菌株在 30°C 时激活预适应反应,从而实现耐热性。酵母GemMap 可视化促进了对系统代谢数据的快速解释。


 京公网安备 11010802027423号