Transport Policy ( IF 6.3 ) Pub Date : 2021-08-25 , DOI: 10.1016/j.tranpol.2021.08.004 Gabriela Cavalcante da Silva 1 , Fernanda Monteiro de Almeida 1 , Sabrina Oliveira 2 , Elizabeth F Wanner 3 , Leonardo C T Bezerra 1 , Ricardo H C Takahashi 4 , Luciana Lima 5
|
Background
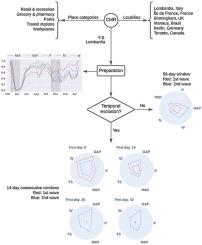
In this paper, we conduct a mobility reduction rate comparison between the first and second COVID-19 waves in several localities from America and Europe using Google community mobility reports (CMR) data. Through multi-dimensional visualization, we are able to compare the reduction in mobility from the different lockdown periods for each locality selected, simultaneously considering multiple place categories provided in CMR. In addition, our analysis comprises a 56-day lockdown period for each locality and COVID-19 wave, which we analyze both as 56-day periods and as 14-day consecutive windows.
Methods
We use locality-wise calibrated CMR data, which we process through seasonal-trend decomposition by LOESS (STL) to isolate trend from seasonal and noise effects. We scale trend data to draw Pareto-compliant conclusions using radar charts. For each temporal granularity considered, data for a given place category is aggregated using the area under the curve (AUC) approach.
Results
In general, reduction rates observed during the first wave were much higher than during the second. Alarmingly, December holiday season mobility in some of the localities reached pre-pandemic levels for some of the place categories reported. Manaus was the only locality where second wave mobility was nearly as reduced as during the first wave, likely due to the P1 variant outbreak and oxygen supply crisis.
中文翻译:
比较第一波和第二波 COVID-19 之间社区流动性的减少
背景
在本文中,我们使用 Google 社区流动性报告 (CMR) 数据对美国和欧洲多个地区第一波和第二波 COVID-19 浪潮的流动性减少率进行了比较。通过多维可视化,我们能够比较所选每个地点不同锁定期的流动性减少情况,同时考虑 CMR 中提供的多个地点类别。此外,我们的分析还包括每个地区的 56 天封锁期和 COVID-19 浪潮,我们将其作为 56 天的时期和 14 天的连续窗口进行分析。
方法
我们使用局部校准的 CMR 数据,通过 LOESS (STL) 进行季节性趋势分解进行处理,以将趋势与季节性和噪声影响隔离开来。我们使用雷达图缩放趋势数据以得出符合帕累托图的结论。对于考虑的每个时间粒度,使用曲线下面积 (AUC) 方法聚合给定地点类别的数据。
结果
总体而言,第一波期间观察到的减少率远高于第二波期间。令人担忧的是,12 月假期期间,一些地区的流动性达到了所报告的某些地区类别大流行前的水平。马瑙斯是唯一一个第二波流动性几乎与第一波期间一样减少的地方,这可能是由于 P1 变种爆发和氧气供应危机造成的。


 京公网安备 11010802027423号