Urban Climate ( IF 6.0 ) Pub Date : 2021-07-07 , DOI: 10.1016/j.uclim.2021.100908 Rehana Khan 1, 2 , Kanike Raghavendra Kumar 1, 3 , Tianliang Zhao 1
|
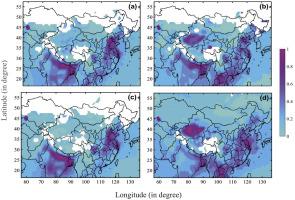
Quantifying the variations of atmospheric aerosols and trace gas concentrations with the impact of lockdown due to the Coronavirus disease of 2019 (COVID-19) pandemic is crucial in understanding urban air quality. For this purpose, we utilized the multi-instrumental approach of satellite remote sensing and reanalysis model data to examine the spatial and temporal patterns of major air pollutants during December 2019–June 2020 in South Asia. The lockdown has to lead to a considerable decrease in aerosol optical thickness (AOT) over South China (−18.92%) and Indo-Gangetic Plain (IGP; −24.29%) compared to its ordinary level for a couple of weeks. Noticeable reductions in tropospheric NO2 are observed over the Pearl River Delta (PRD; −0.3/cm2) followed by Central China (CC) with −0.21/cm2and IGP (−0.085/cm2), and the lowest (−0.0008/cm2) in the Tibetan Plateau (TP) region. The changes observed in PM2.5 and SO2 levels (from −58.56% to - 63.64%) are attributed to the decrease in anthropogenic emissions, vehicular exhaust, and industrial activities. However, the BC concentrations are reduced by approximately halved of its ordinary levels in the IGP (−2.28 μg/m3) followed by YRD (−1.56 μg/m3), CC (−1.5 μg/m3), NCP (−1.29 μg/m3), and PRD (−0.78 μg/m3) regions. The total column O3 predominantly increased from 262.68 to 285.53DU, 323.00 to 343.00DU, and 245.00 to 265.00DU in the YRD, NCP, and IGP areas. This is mainly associated with solar radiation, meteorological factors, and an unprecedented reduction in NOx during the lockdown period.
中文翻译:
评估 COVID-19 封锁期间空气污染物浓度变化及其对南亚城市空气质量的影响
量化 2019 年冠状病毒病 (COVID-19) 大流行导致的封锁影响下大气气溶胶和微量气体浓度的变化对于了解城市空气质量至关重要。为此,我们利用卫星遥感和再分析模型数据的多仪器方法,研究了2019年12月至2020年6月南亚主要空气污染物的时空格局。封锁导致华南(-18.92%)和印度恒河平原(IGP;-24.29%)的气溶胶光学厚度(AOT)在几周内较正常水平大幅下降。珠江三角洲(PRD;−0.3/cm 2 )对流层 NO 2显着减少,其次是华中地区(CC),为−0.21/cm 2和IGP(−0.085/cm 2 ),最低的是(−0.085/cm 2 )。 0.0008/cm 2 )在青藏高原(TP)地区。 PM 2.5和 SO 2水平的变化(从 -58.56% 到 - 63.64%)归因于人为排放、车辆尾气和工业活动的减少。然而,IGP (-2.28 μg/m 3 ) 中的 BC 浓度大约降低了正常水平的一半,其次是 YRD (-1.56 μg/m 3 )、CC (-1.5 μg/m 3 )、NCP (- 1.29 μg/m 3 )和PRD(-0.78 μg/m 3 )区域。在长三角地区、华北地区和IGP地区,总O 3柱主要从262.68增加到285.53DU,从323.00增加到343.00DU,从245.00增加到265.00DU。这主要与太阳辐射、气象因素以及封锁期间氮氧化物空前减少有关。


 京公网安备 11010802027423号