Ecological Informatics ( IF 5.8 ) Pub Date : 2021-06-11 , DOI: 10.1016/j.ecoinf.2021.101352 Nemai Sahani , Tirthankar Ghosh
|
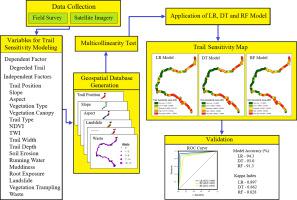
Trails have high conservation value which provides access to the protected area. But expansion of recreational activities along the trail has notably disturbed its environmental quality. The rapid increase of recreational activities along trails of Sikkim Himalayan region has become a major environmental concern. Therefore, modelling and mapping of sensitive trails are essential aspects for decision makers. The present study integrates RS-GIS with different machine learning algorithms to prepare trail susceptibility mapping. Furthermore, the study compares the predictive performance of logistic regression (LR), decision tree (DT) and random forest (RF) model for trail susceptibility mapping. Here we have considered seventeen trail susceptibility conditioning factors as model input. Thereafter, the dataset was randomly divided into two parts: training dataset (70%) and validation dataset (30%). Multicollinearity analysis carried using variance inflation factor (VIF) and tolerance (TOL) to reduce model biasness. Thereafter, trail susceptibility map prepared using LR, DT and RF models. Finally, Receiver operating curve (ROC)- area under curve (AUC) method, statistical overall accuracy (OA) and Kappa index were used to measure the predictive performance of the models. The study concluded that LR (AUC-0.948, OA-94.8% and Kappa Index- 0.897) gives better performance in overall accuracy assessment as compared to DT (AUC- 0.931, OA- 93% and Kappa Index- 0.862) and RF (AUC- 0.914, OA- 91.3% and Kappa Index- 0.828) model.
中文翻译:
使用逻辑回归、决策树和随机森林模型基于 GIS 的锡金喜马拉雅保护区休闲步道敏感性空间预测
小径具有很高的保护价值,可以进入保护区。但沿小径扩大康乐活动已显着扰乱了其环境质量。锡金喜马拉雅地区小径上休闲活动的迅速增加已成为一个主要的环境问题。因此,敏感路径的建模和映射是决策者的重要方面。本研究将 RS-GIS 与不同的机器学习算法相结合,以准备路径磁敏度图。此外,该研究比较了逻辑回归 (LR)、决策树 (DT) 和随机森林 (RF) 模型对路径敏感性映射的预测性能。在这里,我们考虑了 17 个路径敏感性调节因素作为模型输入。此后,数据集被随机分为两部分:训练数据集 (70%) 和验证数据集 (30%)。多重共线性分析使用方差膨胀因子 (VIF) 和容差 (TOL) 来减少模型偏差。此后,使用 LR、DT 和 RF 模型准备路径敏感性图。最后,接受者操作曲线(ROC)-曲线下面积(AUC)方法、统计总体准确度(OA)和Kappa指数用于衡量模型的预测性能。该研究得出的结论是,与 DT(AUC-0.931、OA-93% 和 Kappa 指数-0.862)和 RF(AUC)相比,LR(AUC-0.948、OA-94.8% 和 Kappa 指数-0.897)在总体准确度评估中表现更好- 0.914,OA- 91.3% 和 Kappa 指数 - 0.828) 模型。此后,使用 LR、DT 和 RF 模型准备路径敏感性图。最后,接受者操作曲线(ROC)-曲线下面积(AUC)方法、统计总体准确度(OA)和Kappa指数用于衡量模型的预测性能。该研究得出的结论是,与 DT(AUC-0.931、OA-93% 和 Kappa 指数-0.862)和 RF(AUC)相比,LR(AUC-0.948、OA-94.8% 和 Kappa 指数-0.897)在总体准确度评估中表现更好- 0.914,OA- 91.3% 和 Kappa 指数 - 0.828) 模型。此后,使用 LR、DT 和 RF 模型准备路径敏感性图。最后,接受者操作曲线(ROC)-曲线下面积(AUC)方法、统计总体准确度(OA)和Kappa指数用于衡量模型的预测性能。该研究得出的结论是,与 DT(AUC-0.931、OA-93% 和 Kappa 指数-0.862)和 RF(AUC)相比,LR(AUC-0.948、OA-94.8% 和 Kappa 指数-0.897)在总体准确度评估中表现更好- 0.914,OA- 91.3% 和 Kappa 指数 - 0.828) 模型。


 京公网安备 11010802027423号