Our official English website, www.x-mol.net, welcomes your
feedback! (Note: you will need to create a separate account there.)
Neighbourhood change and spatial inequalities in Cape Town
The Geographical Journal ( IF 3.6 ) Pub Date : 2021-06-05 , DOI: 10.1111/geoj.12400 Christopher D. Lloyd 1 , Saad Bhatti 2 , David McLennan 3 , Michael Noble 3 , Gerbrand Mans 4
The Geographical Journal ( IF 3.6 ) Pub Date : 2021-06-05 , DOI: 10.1111/geoj.12400 Christopher D. Lloyd 1 , Saad Bhatti 2 , David McLennan 3 , Michael Noble 3 , Gerbrand Mans 4
Affiliation
|
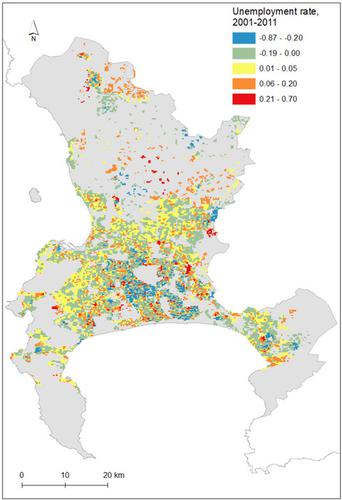
Capturing the dynamics of population change in urban areas necessitates access to geographically fine-grained and temporally consistent data for several time points. Such data are generally not available and they must be created using standard population data which cannot usually be compared across time periods. In this paper, the focus is on changing spatial inequalities in Cape Town, South Africa. This paper details an approach to generation of gridded population counts (250 m by 250 m) for two census years – 2001 and 2011. Census data for Small Area Layers (SALs), Spot Building Count (SBC) data, and Open Street Map (OSM) landuse data were used to construct a grid of populated cells to which population counts are then reallocated. The reallocation of population counts from SALs to grid cells was undertaken using area-to-point kriging – an approach which is informed by the spatial variation in the population groups of interest as measured using the variogram. A case study based on population grids of unemployment rates shows how the grids can be used to chart changes and also to measure spatial inequalities across the city at two time points. The advantages of grids for capturing fine-scale complexities and correctly accounting for physical separation between communities are demonstrated and the results show, while the broad patterns of inequality are consistent across time, there are pronounced increases in inequalities in some neighbourhoods. These areas – and what leads some areas to fall further behind – should be the subject of attention by policy-makers.
中文翻译:

开普敦的邻里变化和空间不平等
捕捉城市地区人口变化的动态需要访问几个时间点的地理细粒度和时间一致的数据。此类数据通常不可用,必须使用通常无法跨时间段进行比较的标准人口数据创建。在本文中,重点是改变南非开普敦的空间不平等。本文详细介绍了在 2001 年和 2011 年两个人口普查年(2001 年和 2011 年)中生成网格化人口计数(250 m x 250 m)的方法。小区域层 (SAL) 的人口普查数据、点建筑物计数 (SBC) 数据和开放街道地图 ( OSM) 土地利用数据被用来构建一个人口密度网格,然后将人口计数重新分配到该网格。人口计数从 SAL 到网格单元的重新分配是使用区域对点克里金法进行的——这种方法通过使用变异函数测量的感兴趣人口组的空间变化来进行。一项基于失业率人口网格的案例研究显示了如何使用网格来绘制变化图表,以及衡量两个时间点的整个城市的空间不平等。网格在捕捉精细尺度复杂性和正确解释社区之间物理分离方面的优势得到了证明,结果表明,虽然不平等的广泛模式随着时间的推移是一致的,但某些社区的不平等现象明显增加。这些领域——以及导致某些领域进一步落后的原因——应该成为政策制定者关注的主题。
更新日期:2021-06-05
中文翻译:
开普敦的邻里变化和空间不平等
捕捉城市地区人口变化的动态需要访问几个时间点的地理细粒度和时间一致的数据。此类数据通常不可用,必须使用通常无法跨时间段进行比较的标准人口数据创建。在本文中,重点是改变南非开普敦的空间不平等。本文详细介绍了在 2001 年和 2011 年两个人口普查年(2001 年和 2011 年)中生成网格化人口计数(250 m x 250 m)的方法。小区域层 (SAL) 的人口普查数据、点建筑物计数 (SBC) 数据和开放街道地图 ( OSM) 土地利用数据被用来构建一个人口密度网格,然后将人口计数重新分配到该网格。人口计数从 SAL 到网格单元的重新分配是使用区域对点克里金法进行的——这种方法通过使用变异函数测量的感兴趣人口组的空间变化来进行。一项基于失业率人口网格的案例研究显示了如何使用网格来绘制变化图表,以及衡量两个时间点的整个城市的空间不平等。网格在捕捉精细尺度复杂性和正确解释社区之间物理分离方面的优势得到了证明,结果表明,虽然不平等的广泛模式随着时间的推移是一致的,但某些社区的不平等现象明显增加。这些领域——以及导致某些领域进一步落后的原因——应该成为政策制定者关注的主题。


 京公网安备 11010802027423号