当前位置:
X-MOL 学术
›
Int. J. Climatol.
›
论文详情
Our official English website, www.x-mol.net, welcomes your
feedback! (Note: you will need to create a separate account there.)
Trends of daily extreme and non-extreme rainfall indices and intercomparison with different gridded data sets over Mexico and the southern United States
International Journal of Climatology ( IF 3.5 ) Pub Date : 2021-05-26 , DOI: 10.1002/joc.7225 Gabriela Colorado‐Ruiz 1 , Tereza Cavazos 1
International Journal of Climatology ( IF 3.5 ) Pub Date : 2021-05-26 , DOI: 10.1002/joc.7225 Gabriela Colorado‐Ruiz 1 , Tereza Cavazos 1
Affiliation
|
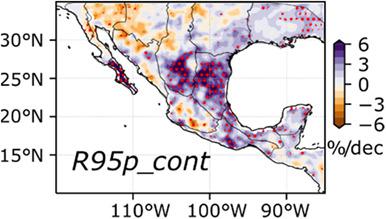
Trends of 15 extreme and non-extreme daily rainfall indices for Mexico and the southern United States are analyzed for the extended boreal winter (November–March) and summer (June–October) during 1981–2010. The analysis includes gridded observations (CHIRPS and Livneh), reanalyses (ERA5, ERA-Interim, MERRA2, and CFSR), the regional climate model RegCM4.7 (forced by ERA-Interim), and four general circulation models (GCMs) from the CMIP5 (HadGEM2-ES, CNRM-CM5, MPI-ESM-MR, and GFDL-ESM2M). The domain is divided into 13 regions with similar seasonal rainfall patterns according to the k-means algorithm applied to CHIRPS monthly precipitation, as a reference. Gridded observations and reanalyses (O&R) show similar regional annual cycles and metrics of precipitation. The two observational data sets show the largest differences in the magnitude of some indices in the wettest region (southeastern Mexico) and in the monsoon. During summer, O&R show positive significant trends in extreme rainfall indices in regions commonly affected by tropical cyclones (southern Baja California Peninsula, northeastern Mexico, and the southeastern United States), while negative significant trends of seasonal accumulation of rainfall are seen in the Mediterranean Californias and the Sonoran Desert region. There is an agreement among most data sets that the frequency and intensity of extreme winter precipitation indices have declined in northwest Mexico and the southwestern United States, but trends are not statistically significant, while southeastern Mexico shows significant increases in 5-days accumulation (rx5d). ERA5 followed by MERRA2 show the best performance. RegCM4.7 reproduces the annual cycle of precipitation in most of the regions and captures the main trend signals especially in winter, but it has difficulties in reproducing the summer interannual variability of few indices. The GCMs tend to overestimate (underestimate) the annual cycle of precipitation and the median values of extreme indices in the driest (wettest) regions. They are not able to capture the regional trends of the indices.
中文翻译:

墨西哥和美国南部每日极端和非极端降雨指数的趋势以及与不同网格数据集的比对
针对 1981 年至 2010 年期间延长的北方冬季(11 月至 3 月)和夏季(6 月至 10 月),分析了墨西哥和美国南部 15 个极端和非极端日降雨量指数的趋势。分析包括网格观测(CHIRPS 和 Livneh)、再分析(ERA5、ERA-Interim、MERRA2 和 CFSR)、区域气候模型 RegCM4.7(由 ERA-Interim 强制)以及来自CMIP5(HadGEM2-ES、CNRM-CM5、MPI-ESM-MR 和 GFDL-ESM2M)。根据应用于 CHIRPS 月降水量的 k-means 算法,将该域划分为 13 个季节性降雨模式相似的区域,作为参考。网格观测和再分析 (O&R) 显示了类似的区域年度周期和降水指标。两个观测数据集显示了最潮湿地区(墨西哥东南部)和季风中某些指数的大小差异最大。在夏季,O&R 在通常受热带气旋影响的地区(下加利福尼亚半岛南部、墨西哥东北部和美国东南部)的极端降雨指数呈显着正向显着趋势,而在地中海加利福尼亚州则呈现出显着负向季节性降雨累积趋势和索诺兰沙漠地区。大多数数据集一致认为,墨西哥西北部和美国西南部极端冬季降水指数的频率和强度有所下降,但趋势没有统计学意义,而墨西哥东南部的 5 天累积量(rx5d)显着增加. ERA5 其次是 MERRA2 表现最好。RegCM4.7再现了大部分地区降水的年循环,捕捉了主要趋势信号,尤其是冬季,但难以再现少数指标的夏季年际变化。GCM 倾向于高估(低估)降水的年周期和最干旱(最潮湿)地区极端指数的中值。他们无法捕捉指数的区域趋势。GCM 倾向于高估(低估)降水的年周期和最干旱(最潮湿)地区极端指数的中值。他们无法捕捉指数的区域趋势。GCM 倾向于高估(低估)降水的年周期和最干旱(最潮湿)地区极端指数的中值。他们无法捕捉指数的区域趋势。
更新日期:2021-05-26
中文翻译:
墨西哥和美国南部每日极端和非极端降雨指数的趋势以及与不同网格数据集的比对
针对 1981 年至 2010 年期间延长的北方冬季(11 月至 3 月)和夏季(6 月至 10 月),分析了墨西哥和美国南部 15 个极端和非极端日降雨量指数的趋势。分析包括网格观测(CHIRPS 和 Livneh)、再分析(ERA5、ERA-Interim、MERRA2 和 CFSR)、区域气候模型 RegCM4.7(由 ERA-Interim 强制)以及来自CMIP5(HadGEM2-ES、CNRM-CM5、MPI-ESM-MR 和 GFDL-ESM2M)。根据应用于 CHIRPS 月降水量的 k-means 算法,将该域划分为 13 个季节性降雨模式相似的区域,作为参考。网格观测和再分析 (O&R) 显示了类似的区域年度周期和降水指标。两个观测数据集显示了最潮湿地区(墨西哥东南部)和季风中某些指数的大小差异最大。在夏季,O&R 在通常受热带气旋影响的地区(下加利福尼亚半岛南部、墨西哥东北部和美国东南部)的极端降雨指数呈显着正向显着趋势,而在地中海加利福尼亚州则呈现出显着负向季节性降雨累积趋势和索诺兰沙漠地区。大多数数据集一致认为,墨西哥西北部和美国西南部极端冬季降水指数的频率和强度有所下降,但趋势没有统计学意义,而墨西哥东南部的 5 天累积量(rx5d)显着增加. ERA5 其次是 MERRA2 表现最好。RegCM4.7再现了大部分地区降水的年循环,捕捉了主要趋势信号,尤其是冬季,但难以再现少数指标的夏季年际变化。GCM 倾向于高估(低估)降水的年周期和最干旱(最潮湿)地区极端指数的中值。他们无法捕捉指数的区域趋势。GCM 倾向于高估(低估)降水的年周期和最干旱(最潮湿)地区极端指数的中值。他们无法捕捉指数的区域趋势。GCM 倾向于高估(低估)降水的年周期和最干旱(最潮湿)地区极端指数的中值。他们无法捕捉指数的区域趋势。


 京公网安备 11010802027423号