Current Bioinformatics ( IF 2.4 ) Pub Date : 2021-02-28 , DOI: 10.2174/1574893615999200629124444 Chen-An, Tsai
|
Background: Gene set enrichment analyses (GSEA) provide a useful and powerful approach to identify differentially expressed gene sets with prior biological knowledge. Several GSEA algorithms have been proposed to perform enrichment analyses on groups of genes. However, many of these algorithms have focused on the identification of differentially expressed gene sets in a given phenotype.
Objective: In this paper, we propose a gene set analytic framework, Gene Set Correlation Analysis (GSCoA), that simultaneously measures within and between gene sets variation to identify sets of genes enriched for differential expression and highly co-related pathways.
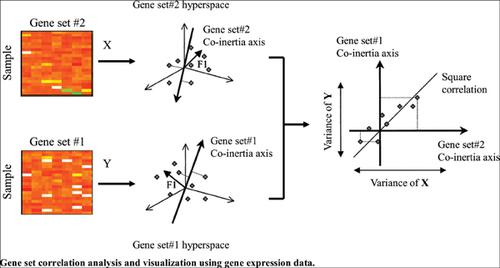
Methods: We apply co-inertia analysis to the comparisons of cross-gene sets in gene expression data to measure the co-structure of expression profiles in pairs of gene sets. Co-inertia analysis (CIA) is one multivariate method to identify trends or co-relationships in multiple datasets, which contain the same samples. The objective of CIA is to seek ordinations (dimension reduction diagrams) of two gene sets such that the square covariance between the projections of the gene sets on successive axes is maximized. Simulation studies illustrate that CIA offers superior performance in identifying corelationships between gene sets in all simulation settings when compared to correlation-based gene set methods.
Result and Conclusion: We also combine between-gene set CIA and GSEA to discover the relationships between gene sets significantly associated with phenotypes. In addition, we provide a graphical technique for visualizing and simultaneously exploring the associations between and within gene sets and their interaction and network. We then demonstrate the integration of within and between gene sets variation using CIA and GSEA, applied to the p53 gene expression data using the c2 curated gene sets. Ultimately, the GSCoA approach provides an attractive tool for the identification and visualization of novel associations between pairs of gene sets by integrating corelationships between gene sets into gene set analysis.
中文翻译:
使用基因表达数据进行基因组相关性分析和可视化
背景:基因集富集分析(GSEA)提供了一种有用且强大的方法,可以通过先验的生物学知识鉴定差异表达的基因集。已经提出了几种GSEA算法来对基因组进行富集分析。但是,这些算法中的许多算法都集中于识别给定表型中差异表达的基因集。
目的:在本文中,我们提出了一个基因集分析框架,即基因集相关性分析(GSCoA),该框架可同时测量基因集内部和之间的变异,以鉴定丰富的差异表达和高度相关途径的基因集。
方法:我们将共惯性分析应用于基因表达数据中交叉基因集的比较,以测量成对的基因集中表达谱的共结构。协惯性分析(CIA)是一种用于在包含相同样本的多个数据集中识别趋势或相互关系的多变量方法。CIA的目的是寻找两个基因集的坐标(降维图),以使基因集在连续轴上的投影之间的平方协方差最大化。仿真研究表明,与基于相关的基因集方法相比,CIA在所有仿真设置中的基因集之间的关联关系识别方面均具有出色的性能。
结果与结论:我们还结合了基因组CIA和GSEA之间的关系,以发现与表型显着相关的基因组之间的关系。此外,我们提供了一种图形化的技术,用于可视化并同时探索基因集之间及其内部的关联以及它们之间的相互作用和网络。然后,我们证明了使用CIA和GSEA将基因集内部和之间的变异整合在一起,并使用c2精选基因集将其应用于p53基因表达数据。最终,GSCoA方法提供了一个有吸引力的工具,可通过将基因组之间的关联关系整合到基因组分析中来识别和可视化成对的基因组之间的新型关联。


 京公网安备 11010802027423号