Atmospheric Environment ( IF 4.2 ) Pub Date : 2021-05-18 , DOI: 10.1016/j.atmosenv.2021.118475 R. Peter , J. Kuttippurath , Kunal Chakraborty , N. Sunanda
|
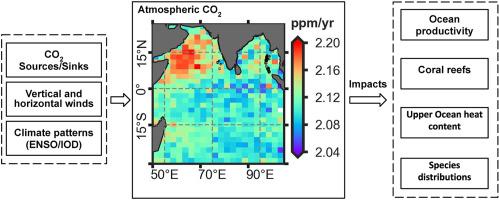
The rapid increase in carbon dioxide (CO2) in the atmosphere due to anthropogenic activities aids global warming that demands immediate attention and policy actions. The changes in weather patterns, such as winds, temperature and precipitation, leading to floods and droughts are linked to the increasing greenhouse gases including CO₂. This situation warrants close and continuous monitoring of atmospheric CO2. Here, the mid-tropospheric CO2 from Atmospheric Infrared Sounder (AIRS) is analysed for the past 14 years over Indian Ocean. The northern hemisphere has a higher CO2 concentration than the southern hemisphere, as most of the landmasses with significant CO2 sources are present in the former region. Seasonal variations show the highest CO2 concentration over the north Indian Ocean (NIO) during MAM (March, April and May), about 388.55 ppm, and lowest during ON (October and November), about 386.92 ppm. In contrast, the south Indian Ocean shows the highest, but the magnitude is smaller than that over NIO, during December, January and February. Arabian Sea (AS) exhibits smaller CO2 concentrations compared to that over Bay of Bengal (BoB). However, AS shows the highest trend of 2.13 ppm/year during the post-monsoon season (ON). The seasonal correlation analysis of the temperature at 10 m and sea surface temperature against mid-tropospheric CO2 shows a higher positive correlation for BoB. These analyses, therefore, provide a detailed understanding of the basin-wide seasonal and inter-annual trends of mid-tropospheric CO2 over Indian Ocean.
中文翻译:
印度洋对流层中层CO 2的时间演变
人为活动引起的大气中二氧化碳(CO 2)的迅速增加有助于全球变暖,需要立即引起注意并采取政策行动。天气模式的变化(例如风,温度和降水)导致洪水和干旱与温室气体(包括CO 2)的增加有关。这种情况需要对大气中的CO 2进行连续密切的监测。在这里,分析了过去14年印度洋上大气红外测深仪(AIRS)的对流层中层CO 2。北半球比南半球具有更高的CO 2浓度,因为大多数陆地都含有大量的CO 2来源存在于以前的地区。季节变化显示,在MAM(3月,4月和5月)期间,北印度洋(NIO)的最高CO 2浓度约为388.55 ppm,而在ON(10月和11月)则最低,约为386.92 ppm。相反,在12月,1月和2月,印度洋南部显示最高,但幅度小于NIO。与孟加拉湾(BoB)上空相比,阿拉伯海(AS)的CO 2浓度更低。但是,在季风后季节(ON),AS的最高趋势为2.13 ppm /年。10 m温度与海面温度与对流层中层CO 2的季节相关性分析显示BoB的正相关性较高。因此,这些分析提供了对印度洋对流层中层CO 2的整个盆地范围的季节性和年际趋势的详细了解。


 京公网安备 11010802027423号