当前位置:
X-MOL 学术
›
Int. J. Climatol.
›
论文详情
Our official English website, www.x-mol.net, welcomes your
feedback! (Note: you will need to create a separate account there.)
Decompositions of Taylor diagram and DISO performance criteria
International Journal of Climatology ( IF 3.5 ) Pub Date : 2021-04-22 , DOI: 10.1002/joc.7149 Qiming Zhou 1 , Deliang Chen 2 , Zengyun Hu 3, 4, 5 , Xi Chen 3, 4, 5
International Journal of Climatology ( IF 3.5 ) Pub Date : 2021-04-22 , DOI: 10.1002/joc.7149 Qiming Zhou 1 , Deliang Chen 2 , Zengyun Hu 3, 4, 5 , Xi Chen 3, 4, 5
Affiliation
|
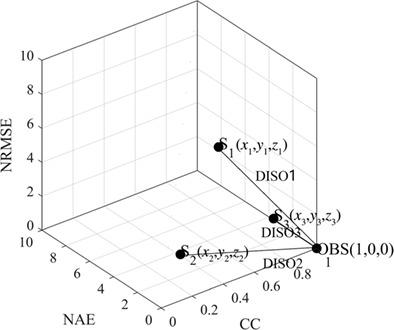
Taylor diagram has been frequently used to evaluate climate or hydrology models or data. A Taylor diagram summarizes three frequently used metrics including correlation coefficient (CC), standard deviation (STD), and centred root mean square error (RMSEc). Although these three metrics are relevant metrics for some applications, in some cases, additional indicators are needed, which calls for a new method. This study firstly addressed the short comments about the distance between indices of simulation and observation (DISO) described in a previous study. Secondly, the number of statistical metrics of DISO is extended from 3 to more than 3. The statistical metrics of the expanded DISO are more flexible than the Taylor diagram which uses the three fixed metrics. Thirdly, the current work compares the Taylor diagram with the expanded DISO in terms of their theoretical bases, revealing the advantage of DISO in terms of its flexibility in the selection of different types of metrics, and its suitability as an effective single metric to express a model's or dataset's overall quality. The power and flexibility of the expanded DISO are discussed.
中文翻译:

泰勒图和 DISO 性能标准的分解
泰勒图经常用于评估气候或水文模型或数据。泰勒图总结了三个常用指标,包括相关系数 (CC)、标准偏差 (STD) 和中心均方根误差 ( RMSE c)。虽然这三个指标是一些应用的相关指标,但在某些情况下,需要额外的指标,这就需要一种新的方法。这项研究首先解决了先前研究中描述的关于模拟和观察指数 (DISO) 之间距离的简短评论。其次,将DISO的统计量度从3个扩展到3个以上。扩展后的DISO的统计量度比使用三个固定量度的泰勒图更加灵活。第三,目前的工作在理论基础上将泰勒图与扩展的 DISO 进行了比较,揭示了 DISO 在选择不同类型度量方面的灵活性方面的优势,以及它作为一种有效的单一度量来表达模型或数据集的整体质量。
更新日期:2021-04-22
中文翻译:
泰勒图和 DISO 性能标准的分解
泰勒图经常用于评估气候或水文模型或数据。泰勒图总结了三个常用指标,包括相关系数 (CC)、标准偏差 (STD) 和中心均方根误差 ( RMSE c)。虽然这三个指标是一些应用的相关指标,但在某些情况下,需要额外的指标,这就需要一种新的方法。这项研究首先解决了先前研究中描述的关于模拟和观察指数 (DISO) 之间距离的简短评论。其次,将DISO的统计量度从3个扩展到3个以上。扩展后的DISO的统计量度比使用三个固定量度的泰勒图更加灵活。第三,目前的工作在理论基础上将泰勒图与扩展的 DISO 进行了比较,揭示了 DISO 在选择不同类型度量方面的灵活性方面的优势,以及它作为一种有效的单一度量来表达模型或数据集的整体质量。


 京公网安备 11010802027423号