当前位置:
X-MOL 学术
›
Int. J. Climatol.
›
论文详情
Our official English website, www.x-mol.net, welcomes your
feedback! (Note: you will need to create a separate account there.)
Southern African temperature responses to major volcanic eruptions since 1883: Simulated by CMIP5 models
International Journal of Climatology ( IF 3.5 ) Pub Date : 2021-04-10 , DOI: 10.1002/joc.7135 P. J. Harvey 1 , S. W. Grab 1
International Journal of Climatology ( IF 3.5 ) Pub Date : 2021-04-10 , DOI: 10.1002/joc.7135 P. J. Harvey 1 , S. W. Grab 1
Affiliation
|
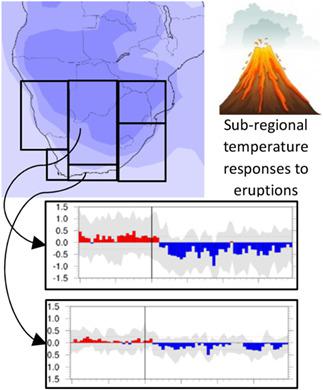
Although volcanic forcing impacts on climate have gained much international attention during recent years, focus has largely been at hemispheric scale, and most particularly on the Northern Hemisphere (NH). Here we investigate the impact of major volcanic eruptions since 1883 on southern African climate, with a view to establishing potential sub-regional differences across a variety of temporal scales. To this end, we use historical simulations from the Coupled Model Intercomparison Project, Phase 5 (CMIP5) to study near-surface temperature responses to four major eruptions (Krakatau, 1883; Santa Maria, 1902; Agung, 1963; Pinatubo, 1991) over six sub-regions of southern Africa. Results show significant cooling across all sub-regions after each eruption. However, we detect considerable sub-regional differences in the amplitude, timing and duration of responses. For instance, stronger temperature departures occur in northern rather than southern sub-regions where diurnal and annual temperature ranges are normally greater. While significant responses occur within the first year after each eruption, there is a more delayed response in three of the sub-regions (southwestern coast and central southern Africa) following the Santa Maria eruption. Strongest responses follow the Krakatau eruption in all sub-regions, while the weakest response follows the Santa Maria eruption in western sub-regions and the Agung eruption in eastern sub-regions. Most regions experience the strongest temperature departures during austral autumn and winter (MAM and JJA), and weakest during spring (SON).
中文翻译:

南部非洲对 1883 年以来主要火山爆发的温度响应:由 CMIP5 模型模拟
尽管近年来火山强迫对气候的影响引起了国际上的广泛关注,但重点主要集中在半球尺度上,尤其是北半球 (NH)。在这里,我们调查了自 1883 年以来的主要火山爆发对南部非洲气候的影响,以期确定各种时间尺度上的潜在次区域差异。为此,我们使用耦合模型比对项目第 5 阶段 (CMIP5) 的历史模拟来研究近地表温度对四次主要喷发(喀拉喀托,1883 年;圣玛丽亚,1902 年;阿贡,1963 年;皮纳图博,1991 年)的响应。南部非洲的六个次区域。结果显示每次喷发后所有子区域都显着降温。然而,我们检测到振幅的相当大的次区域差异,响应的时间和持续时间。例如,在北部而不是南部子区域发生更强的温度偏离,那里的昼夜温差和年温差通常更大。虽然每次火山喷发后的第一年内都会出现显着的反应,但在圣玛丽亚火山喷发后的三个次区域(西南海岸和中南部非洲)的反应更为滞后。在所有次区域的喀拉喀托火山喷发之后反应最强,而在西部次区域的圣玛丽亚火山喷发和东部次区域的阿贡火山喷发之后反应最弱。大多数地区在南方秋季和冬季(MAM 和 JJA)经历最强的温度偏离,在春季(SON)经历最弱的温度偏离。北部分区域的温度偏差更大,而不是南部分区域,在这些分区域,昼夜温差和年温差通常更大。虽然每次火山喷发后的第一年内都会出现显着的反应,但在圣玛丽亚火山喷发后的三个次区域(西南海岸和中南部非洲)的反应更为滞后。在所有次区域的喀拉喀托火山喷发之后反应最强,而在西部次区域的圣玛丽亚火山喷发和东部次区域的阿贡火山喷发之后反应最弱。大多数地区在南方秋季和冬季(MAM 和 JJA)经历最强的温度偏离,在春季(SON)经历最弱的温度偏离。北部分区域的温度偏差更大,而不是南部分区域,在这些分区域,昼夜温差和年温差通常更大。虽然每次火山喷发后的第一年内都会出现显着的反应,但在圣玛丽亚火山喷发后的三个次区域(西南海岸和中南部非洲)的反应更为滞后。在所有次区域的喀拉喀托火山喷发之后反应最强,而在西部次区域的圣玛丽亚火山喷发和东部次区域的阿贡火山喷发之后反应最弱。大多数地区在南方秋季和冬季(MAM 和 JJA)经历最强的温度偏离,在春季(SON)经历最弱的温度偏离。虽然每次火山喷发后的第一年内都会出现显着的反应,但在圣玛丽亚火山喷发后的三个次区域(西南海岸和中南部非洲)的反应更为滞后。在所有次区域的喀拉喀托火山喷发之后反应最强,而在西部次区域的圣玛丽亚火山喷发和东部次区域的阿贡火山喷发之后反应最弱。大多数地区在南方秋季和冬季(MAM 和 JJA)经历最强的温度偏离,在春季(SON)经历最弱的温度偏离。虽然每次火山喷发后的第一年内都会出现显着的反应,但在圣玛丽亚火山喷发后的三个次区域(西南海岸和中南部非洲)的反应更为滞后。在所有次区域的喀拉喀托火山喷发之后反应最强,而在西部次区域的圣玛丽亚火山喷发和东部次区域的阿贡火山喷发之后反应最弱。大多数地区在南方秋季和冬季(MAM 和 JJA)经历最强的温度偏离,在春季(SON)经历最弱的温度偏离。而最弱的反应发生在西部次区域的圣玛丽亚火山喷发和东部次区域的阿贡火山喷发之后。大多数地区在南方秋季和冬季(MAM 和 JJA)经历最强的温度偏离,在春季(SON)经历最弱的温度偏离。而最弱的反应发生在西部次区域的圣玛丽亚火山喷发和东部次区域的阿贡火山喷发之后。大多数地区在南方秋季和冬季(MAM 和 JJA)经历最强的温度偏离,在春季(SON)经历最弱的温度偏离。
更新日期:2021-04-10
中文翻译:
南部非洲对 1883 年以来主要火山爆发的温度响应:由 CMIP5 模型模拟
尽管近年来火山强迫对气候的影响引起了国际上的广泛关注,但重点主要集中在半球尺度上,尤其是北半球 (NH)。在这里,我们调查了自 1883 年以来的主要火山爆发对南部非洲气候的影响,以期确定各种时间尺度上的潜在次区域差异。为此,我们使用耦合模型比对项目第 5 阶段 (CMIP5) 的历史模拟来研究近地表温度对四次主要喷发(喀拉喀托,1883 年;圣玛丽亚,1902 年;阿贡,1963 年;皮纳图博,1991 年)的响应。南部非洲的六个次区域。结果显示每次喷发后所有子区域都显着降温。然而,我们检测到振幅的相当大的次区域差异,响应的时间和持续时间。例如,在北部而不是南部子区域发生更强的温度偏离,那里的昼夜温差和年温差通常更大。虽然每次火山喷发后的第一年内都会出现显着的反应,但在圣玛丽亚火山喷发后的三个次区域(西南海岸和中南部非洲)的反应更为滞后。在所有次区域的喀拉喀托火山喷发之后反应最强,而在西部次区域的圣玛丽亚火山喷发和东部次区域的阿贡火山喷发之后反应最弱。大多数地区在南方秋季和冬季(MAM 和 JJA)经历最强的温度偏离,在春季(SON)经历最弱的温度偏离。北部分区域的温度偏差更大,而不是南部分区域,在这些分区域,昼夜温差和年温差通常更大。虽然每次火山喷发后的第一年内都会出现显着的反应,但在圣玛丽亚火山喷发后的三个次区域(西南海岸和中南部非洲)的反应更为滞后。在所有次区域的喀拉喀托火山喷发之后反应最强,而在西部次区域的圣玛丽亚火山喷发和东部次区域的阿贡火山喷发之后反应最弱。大多数地区在南方秋季和冬季(MAM 和 JJA)经历最强的温度偏离,在春季(SON)经历最弱的温度偏离。北部分区域的温度偏差更大,而不是南部分区域,在这些分区域,昼夜温差和年温差通常更大。虽然每次火山喷发后的第一年内都会出现显着的反应,但在圣玛丽亚火山喷发后的三个次区域(西南海岸和中南部非洲)的反应更为滞后。在所有次区域的喀拉喀托火山喷发之后反应最强,而在西部次区域的圣玛丽亚火山喷发和东部次区域的阿贡火山喷发之后反应最弱。大多数地区在南方秋季和冬季(MAM 和 JJA)经历最强的温度偏离,在春季(SON)经历最弱的温度偏离。虽然每次火山喷发后的第一年内都会出现显着的反应,但在圣玛丽亚火山喷发后的三个次区域(西南海岸和中南部非洲)的反应更为滞后。在所有次区域的喀拉喀托火山喷发之后反应最强,而在西部次区域的圣玛丽亚火山喷发和东部次区域的阿贡火山喷发之后反应最弱。大多数地区在南方秋季和冬季(MAM 和 JJA)经历最强的温度偏离,在春季(SON)经历最弱的温度偏离。虽然每次火山喷发后的第一年内都会出现显着的反应,但在圣玛丽亚火山喷发后的三个次区域(西南海岸和中南部非洲)的反应更为滞后。在所有次区域的喀拉喀托火山喷发之后反应最强,而在西部次区域的圣玛丽亚火山喷发和东部次区域的阿贡火山喷发之后反应最弱。大多数地区在南方秋季和冬季(MAM 和 JJA)经历最强的温度偏离,在春季(SON)经历最弱的温度偏离。而最弱的反应发生在西部次区域的圣玛丽亚火山喷发和东部次区域的阿贡火山喷发之后。大多数地区在南方秋季和冬季(MAM 和 JJA)经历最强的温度偏离,在春季(SON)经历最弱的温度偏离。而最弱的反应发生在西部次区域的圣玛丽亚火山喷发和东部次区域的阿贡火山喷发之后。大多数地区在南方秋季和冬季(MAM 和 JJA)经历最强的温度偏离,在春季(SON)经历最弱的温度偏离。


 京公网安备 11010802027423号