Computer Physics Communications ( IF 7.2 ) Pub Date : 2021-03-02 , DOI: 10.1016/j.cpc.2021.107881 Travis Mackoy , Bharat Kale , Michael E. Papka , Ralph A. Wheeler
|
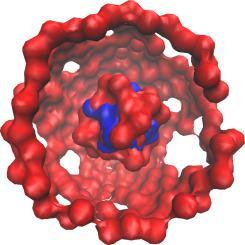
viewSq is a Visual Molecular Dynamics (VMD) module for calculating structure factors () and partial structure factors for any user-selected atomic selections () derived from computer simulation trajectories, as well as quantifying, analyzing, and visualizing atomic contributions to them. viewSq offers radial distribution functions (), and with and without X-ray atomic form factors or neutron scattering lengths, partial radial distribution functions (), as well as decompositions of and into various positive and negative components (each of which indicates periodic atomic ordering). Additionally, viewSq plots as a function of distance the Fourier transform summands used to transform to , allowing understanding of the atom-specific distances around atomic centers that contribute to , , and their various positive and negative components. viewSq will also rank atoms by their contributions to , , and the positive and negative components, and uses VMD to visualize those atoms interactively. Another feature performs the same rankings for atoms within a cutoff distance of a user-selected central atom, allowing the fundamental contributions atoms make with each other to be quantified and interactively visualized. Analysis may be done for any user-selected range of wavenumber () for a single structure or a small ensemble of structures. viewSq’s features are illustrated by using a single frame from an MD simulation of a box of water.
Program summary
Program Title: viewSq
CPC Library link to program files: https://doi.org/10.17632/w5bxkfsj4d.1
Developer’s repository link: https://github.com/tmackoy/viewSq
Licensing provisions: MIT
Programming language: Tcl, Python
Nature of problem: Total scattering, the measurement of a complete diffraction pattern including Bragg and diffuse scattering of radiation, is a powerful family of techniques for investigating the structures of liquids and soft matter [1, 2, 3, 4, 5, 6]. Data are typically derived from X-ray or neutron scattering and reported as a plot of intensity or structure factor (), as a function of wavenumber (). So summarizes in a one-dimensional plot the positions in three-dimensional space of all atomic species, each of which scatters X-rays and neutrons differently. Thus, an experimental can be difficult to interpret [7, 8, 9, 10, 11, 12, 13], although recent advances have been made [14, 15, 16]. Computer simulations (e.g. molecular dynamics (MD) or Monte Carlo simulations) complement experiment by allowing calculated to be calculated from a structural model [17, 18, 19, 20, 21, 22, 23, 24, 25, 26, 27, 28] and decomposed into partial structure factors (), each associated with user-defined atomic selections [29, 30, 31, 32]. While are informative, they are also difficult to analyze for determining the structural ordering underlying . Not only are difficult to conceptualize, but each is the sum of positive and negative components, which each indicate periodic atomic ordering. Moreover, these components partially or nearly completely cancel and are often large in magnitude compared with and . Numerous computer programs exist to calculate (e.g. by performing the Fourier transform of the radial distribution function ()) derived from molecular simulations [17, 18, 19, 20, 21, 22, 23, 24, 25, 26, 27, 28]. Publicly available computer programs focus on accurately reproducing the experimental and/or incorporating the simulated into a structure refinement algorithm. viewSq not only calculates and , but it is unique because it also emphasizes interpreting and visualizing atomic contributions to and .
Solution method: While several tools exist for calculating and from atomistic simulations [17, 18, 19, 20, 21, 22, 23, 24, 25, 26, 27, 28], viewSq is to our knowledge the first program that also provides positive and negative components of and , and allows ready visualization of atomic contributions to , , and the positive and negative components of and . Options contained in this release of viewSq include:
1. Select a single structure or an ensemble of structures to analyze.
2. Select one or a range of to analyze.
3. Calculate and using any number of trajectory snapshots.
4. Select chemically relevant atom subsets for calculation of partial radial distribution functions () and .
5. Separately sum positive and negative Fourier transform summands constituting and , to determine positive and negative components of and .
6. Display summands composing or as a function of distance from atomic centers (or a user selection of atomic centers).
7. Quantify compositions of , , or summands for any combination of .
8. Rank atoms by their contributions to and .
9. Display atoms making the largest contributions to or at selected values of . This can be done for the entire simulation box or with respect to one central atom.
10. Calculations and analysis can be accomplished using X-ray scattering atomic form factors, neutron scattering lengths, or neither.
Features 5–9 are currently unique to viewSq and provide a suite of tools for analyzing and visualizing and from atomistic simulations. Thus, viewSq is a Visual Molecular Dynamics [33] (VMD) module that provides a uniquely powerful interactive experience to interpret peaks in calculated for X-ray scattering, neutron scattering, or independent of atomic interactions with radiation. viewSq was designed as a Visual Molecular Dynamics (VMD) module because VMD can readily load, analyze, and visualize the types and sizes of trajectories often used for studies.
Additional comments including restrictions and unusual features: Because viewSq pre-calculates a variety of quantities in order to provide a unique analysis and interactive visualization experience, the memory, time, and disk usage are higher than other programs for simple and calculations. Additionally, the memory requirements grow with number of atoms and might be restrictive even on machines with 64+ GB RAM for simulations with over 25,000 atoms. Advantages to viewSq include its unique features and visualizations that are not available in programs which solely calculate and . viewSq is only compatible with rectangular simulation boxes.
中文翻译:
viewSq,一个视觉分子动力学(VMD)模块,用于通过原子模拟计算,分析和可视化X射线和中子结构因子
viewSq是一个视觉分子动力学(VMD)模块,用于计算结构因子()和用户选择的任何原子选择的部分结构因子()源自计算机仿真轨迹,以及量化,分析和可视化对它们的原子贡献。viewSq提供径向分布函数(), 和 具有和不具有X射线原子形状因数或中子散射长度,部分径向分布函数(),以及 和 分为各种正负成分(每个成分都表示原子的周期性排列)。此外,viewSq绘图是距离的函数 用于变换的傅立叶变换求和 至 ,可以了解原子中心周围特定于原子的距离,这些距离有助于 , ,以及它们的各种正面和负面成分。viewSq还将按原子对原子的贡献进行排名, ,以及正负分量,并使用VMD交互式地可视化这些原子。另一个功能是对用户选择的中心原子的截止距离内的原子执行相同的排名,从而使原子彼此之间做出的基本贡献得以量化并进行交互可视化。可以对用户选择的任何波数范围进行分析()用于单个结构或小型结构集合。viewSq的功能通过使用一盒水的MD模拟中的单个帧来说明。
计划摘要
节目名称: viewSq
CPC库链接到程序文件: https : //doi.org/10.17632/w5bxkfsj4d.1
开发人员的资料库链接: https : //github.com/tmackoy/viewSq
许可条款:麻省理工学院
编程语言: Tcl,Python
问题的性质:总散射,包括辐射的布拉格散射和漫散射在内的完整衍射图的测量,是研究液体和软物质结构的强大技术家族[1,2,3,4,5,6] 。数据通常来自X射线或中子散射,并以强度或结构因子(),作为波数()。所以在一个一维图中总结了所有原子物种在三维空间中的位置,每个原子对X射线和中子的散射均不同。因此,一个实验性的尽管最近取得了一些进展[14、15、16],但很难解释[7、8、9、10、11、12、13]。计算机模拟(例如分子动力学(MD)或蒙特卡洛模拟)通过允许计算得到的结果来补充实验 根据结构模型[17、18、19、20、21、22、23、24、25、26、27、28]计算并分解为部分结构因子(),每个都与用户定义的原子选择相关联[29、30、31、32]。尽管 信息丰富,也难以分析以确定潜在的结构顺序 。不仅是 很难概念化,但是每个 是正和负成分的总和,每个成分都表示原子的周期性排列。而且,这些分量部分或几乎完全抵消,并且与 和 。存在许多计算机程序可以计算 (例如,通过执行径向分布函数的傅立叶变换())源自分子模拟[17,18,19,20,21,22,23,24,25,26,27,28]。公开可用的计算机程序专注于准确再现实验 和/或合并模拟 进入结构细化算法。viewSq不仅可以计算 和 ,但它很独特,因为它还强调了解释和可视化对原子的贡献 和 。
解决方法:虽然有几种计算工具 和 根据原子模拟[17、18、19、20、21、22、23、24、25、26、27、28],viewSq是我们所知的第一个程序,它也提供了正负分量 和 ,并且可以直观地查看对原子的贡献 , ,以及 和 。此版本的viewSq中包含的选项包括:
1.选择一个结构或一组结构进行分析。
2.选择一个 或一系列 分析。
3.计算 和 使用任意数量的轨迹快照。
4.选择化学相关的原子子集,以计算部分径向分布函数() 和 。
5.分别将构成正负傅里叶变换求和的和 和 ,以确定正负分量 和 。
6.显示求和构成 或者 与距原子中心的距离(或用户对原子中心的选择)的函数。
7.量化 , ,或以下项的任意组合的求和 。
8.按原子对原子的贡献进行排序 和 。
9.展示对原子贡献最大的原子 或者 在选定的值 。这可以针对整个模拟盒或相对于一个中心原子来完成。
10.可以使用X射线散射原子形状因子,中子散射长度或两者都不进行计算和分析。
目前,功能5–9是viewSq独有的功能,并提供了一套用于分析和可视化的工具 和 来自原子模拟。因此,viewSq是一个视觉分子动力学[33](VMD)模块,可提供独特强大的交互体验来解释其中的峰。用于X射线散射,中子散射或与原子与辐射的相互作用无关的计算。viewSq被设计为可视分子动力学(VMD)模块,因为VMD可以轻松加载,分析和可视化经常用于的轨迹的类型和大小。 学习。
其他注释包括限制和异常功能:由于viewSq会预先计算各种数量以提供独特的分析和交互式可视化体验,因此内存,时间和磁盘使用率比其他程序要高,因此简单易行 和 计算。此外,内存需求随着原子数量的增长而增长,即使在具有超过64 GB RAM的计算机上进行25,000多个原子的仿真时,内存需求也可能会受到限制。viewSq的优点包括其独特的功能和可视化效果,这些功能和可视化效果在仅用于计算的程序中是不可用的 和 。viewSq仅与矩形模拟框兼容。


 京公网安备 11010802027423号