Journal of Molecular Graphics and Modelling ( IF 2.7 ) Pub Date : 2021-01-04 , DOI: 10.1016/j.jmgm.2021.107832 Daniel R Roe 1 , Bernard R Brooks 1
|
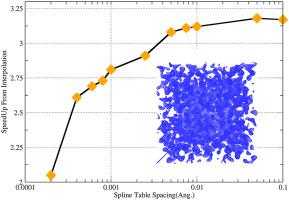
Visualizing data generated from molecular dynamics simulations can be difficult, particularly when there can be thousands to millions of trajectory frames. The creation of a 3D grid of atomic density (i.e. a volumetric map) is one way to easily view the long-time average behavior of a system. One way to generate volumetric maps is by approximating each atom with a Gaussian function centered on that atom and spread over neighboring grid cells. However the calculation of the Gaussian function requires evaluation of the exponential function, which is computationally costly. Here we report on speeding up the calculation of volumetric maps from molecular dynamics trajectory data by replacing the expensive exponential function evaluation with an approximation using interpolating cubic splines. We also discuss the errors involved in this approximation, and recommend settings for volumetric map creation based on this.
中文翻译:
通过三次样条插值提高体积密度图的生成速度
可视化分子动力学模拟产生的数据可能很困难,特别是当可能有数千到数百万个轨迹帧时。创建原子密度的 3D 网格(即体积图)是轻松查看系统长期平均行为的一种方法。生成体积图的一种方法是使用以该原子为中心并分布在相邻网格单元上的高斯函数来近似每个原子。然而,高斯函数的计算需要对指数函数进行评估,这在计算上是昂贵的。在这里,我们报告了通过使用插值三次样条的近似值替换昂贵的指数函数评估来加快从分子动力学轨迹数据计算体积图的速度。我们还讨论了这种近似中涉及的误差,


 京公网安备 11010802027423号