当前位置:
X-MOL 学术
›
Hydrol. Process.
›
论文详情
Our official English website, www.x-mol.net, welcomes your
feedback! (Note: you will need to create a separate account there.)
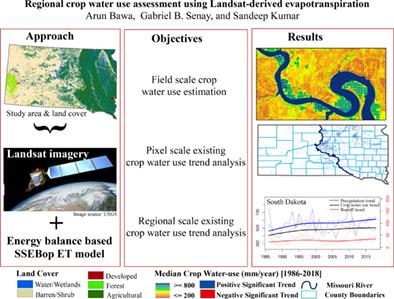
Regional crop water use assessment using Landsat‐derived evapotranspiration
Hydrological Processes ( IF 2.8 ) Pub Date : 2020-12-18 , DOI: 10.1002/hyp.14015 Arun Bawa 1 , Gabriel B. Senay 2 , Sandeep Kumar 3
Hydrological Processes ( IF 2.8 ) Pub Date : 2020-12-18 , DOI: 10.1002/hyp.14015 Arun Bawa 1 , Gabriel B. Senay 2 , Sandeep Kumar 3
Affiliation
|
Reliable information on water use and availability at basin and field scales are important to ensure the optimized constructive uses of available water resources. This study was conducted with the specific objective to estimate Landsat‐based actual evapotranspiration (ETa) using the Operational Simplified Surface Energy Balance (SSEBop) model across the state of South Dakota (SD), USA for the 1986–2018 (33‐year) period. Validated ETa estimations (r2 = 0.91, PBIAS = −4%, and %RMSE = 11.8%) were further used to understand the crop water‐use characteristics and existing historic mono‐directional (increasing/decreasing) trends over the eastern (ESD) and western (WSD) regions of SD. The crop water‐use characteristics indicated that the annual cropland water uses across the ESD and WSD were more or less met by the precipitation amounts in the area. The ample water supply and distribution have led to high rainfed and low percentage of irrigated cropland (~2.5%) in the state. The WSD faced greater crop‐water use reductions than the ESD during drought periods. The landscape ETa responses across the state were found to be more sensitive than precipitation for the drought impact assessments. The Mann Kendall trend analysis revealed the absence of a significant trend (p > 0.05) in annual ETa at a regional scale due to the varying weather conditions in the state. However, about 12% and 9% cropland areas in the ESD and WSD, respectively, revealed a significant mono‐directional trend at pixel scale ETa. Most of the pixels under significant trend showed an increasing trend that can be explained by the shift in agricultural practices, increased irrigated cropland area, higher productions, moisture regime shifts, and decreased risk of farming in the dry areas. The decreasing trend pixels were clustered in mid‐eastern SD and could be the result of dynamic conversion of wetlands to croplands and decreased irrigation practices in the region. This study also demonstrates the tremendous potential and robustness of the SSEBop model, Landsat imagery, and remote sensing‐based ETa modelling approaches in estimating consistent spatially distributed evapotranspiration.
中文翻译:

利用Landsat的蒸散量进行区域作物用水评估
关于流域和田间规模的水资源利用和可用性的可靠信息对于确保优化建设性利用可用水资源至关重要。这项研究的特定目的是使用美国南达科他州(SD)的1986-2018年(33年)的操作性简化表面能平衡(SSEBop)模型估算基于Landsat的实际蒸散量(ETa)。期。经验证的ETa估计值(r 2= 0.91,PBIAS = -4%,%RMSE = 11.8%)被用来了解作物水分利用特征和东部(ESD)和西部(WSD)现有的历史性单向(增加/减少)趋势。 SD的区域。作物用水特征表明,该地区的降水量或多或少地满足了ESD和WSD的年度农田水使用量。充足的水供应和分配导致该州雨水过多,灌溉农田的比例较低(约2.5%)。在干旱时期,水务署面临的农作物用水减少量比可持续发展教育的减少幅度更大。在干旱影响评估中,发现全州的景观ETa响应比降水更敏感。曼恩·肯德尔(Mann Kendall)趋势分析显示不存在明显趋势(p (> 0.05),因为该州的天气状况各不相同。但是,在ESD和WSD中,分别约有12%和9%的耕地面积显示出像素级ETa上的显着单向趋势。处于显着趋势下的大多数像素显示出增加的趋势,这可以用农业实践的变化,灌溉农田面积的增加,产量的增加,水分状况的变化以及干旱地区耕作风险的降低来解释。趋势像素的减少集中在SD中东部,可能是湿地向农田动态转化以及该地区灌溉实践减少的结果。这项研究还证明了SSEBop模型,Landsat影像,
更新日期:2021-01-19
中文翻译:
利用Landsat的蒸散量进行区域作物用水评估
关于流域和田间规模的水资源利用和可用性的可靠信息对于确保优化建设性利用可用水资源至关重要。这项研究的特定目的是使用美国南达科他州(SD)的1986-2018年(33年)的操作性简化表面能平衡(SSEBop)模型估算基于Landsat的实际蒸散量(ETa)。期。经验证的ETa估计值(r 2= 0.91,PBIAS = -4%,%RMSE = 11.8%)被用来了解作物水分利用特征和东部(ESD)和西部(WSD)现有的历史性单向(增加/减少)趋势。 SD的区域。作物用水特征表明,该地区的降水量或多或少地满足了ESD和WSD的年度农田水使用量。充足的水供应和分配导致该州雨水过多,灌溉农田的比例较低(约2.5%)。在干旱时期,水务署面临的农作物用水减少量比可持续发展教育的减少幅度更大。在干旱影响评估中,发现全州的景观ETa响应比降水更敏感。曼恩·肯德尔(Mann Kendall)趋势分析显示不存在明显趋势(p (> 0.05),因为该州的天气状况各不相同。但是,在ESD和WSD中,分别约有12%和9%的耕地面积显示出像素级ETa上的显着单向趋势。处于显着趋势下的大多数像素显示出增加的趋势,这可以用农业实践的变化,灌溉农田面积的增加,产量的增加,水分状况的变化以及干旱地区耕作风险的降低来解释。趋势像素的减少集中在SD中东部,可能是湿地向农田动态转化以及该地区灌溉实践减少的结果。这项研究还证明了SSEBop模型,Landsat影像,


 京公网安备 11010802027423号