Progress in Earth and Planetary Science ( IF 3.9 ) Pub Date : 2020-12-14 , DOI: 10.1186/s40645-020-00394-4 Rui Ito , Tosiyuki Nakaegawa , Izuru Takayabu
|
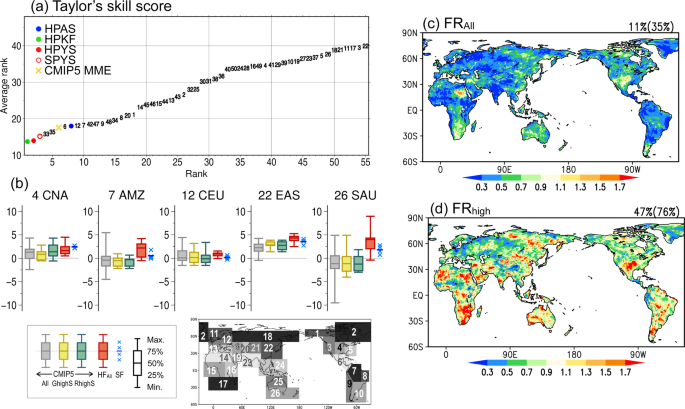
Ensembles of climate change projections created by general circulation models (GCMs) with high resolution are increasingly needed to develop adaptation strategies for regional climate change. The Meteorological Research Institute atmospheric GCM version 3.2 (MRI-AGCM3.2), which is listed in the Coupled Model Intercomparison Project phase 5 (CMIP5), has been typically run with resolutions of 60 km and 20 km. Ensembles of MRI-AGCM3.2 consist of members with multiple cumulus convection schemes and different patterns of future sea surface temperature, and are utilized together with their downscaled data; however, the limited size of the high-resolution ensemble may lead to undesirable biases and uncertainty in future climate projections that will limit its appropriateness and effectiveness for studies on climate change and impact assessments. In this study, to develop a comprehensive understanding of the regional precipitation simulated with MRI-AGCM3.2, we investigate how well MRI-AGCM3.2 simulates the present-day regional precipitation around the globe and compare the uncertainty in future precipitation changes and the change projection itself between MRI-AGCM3.2 and the CMIP5 multiple atmosphere–ocean coupled GCM (AOGCM) ensemble. MRI-AGCM3.2 reduces the bias of the regional mean precipitation obtained with the high-performing CMIP5 models, with a reduction of approximately 20% in the bias over the Tibetan Plateau through East Asia and Australia. When 26 global land regions are considered, MRI-AGCM3.2 simulates the spatial pattern and the regional mean realistically in more regions than the individual CMIP5 models. As for the future projections, in 20 of the 26 regions, the sign of annual precipitation change is identical between the 50th percentiles of the MRI-AGCM3.2 ensemble and the CMIP5 multi-model ensemble. In the other six regions around the tropical South Pacific, the differences in modeling with and without atmosphere–ocean coupling may affect the projections. The uncertainty in future changes in annual precipitation from MRI-AGCM3.2 partially overlaps the maximum–minimum uncertainty range from the full ensemble of the CMIP5 models in all regions. Moreover, on average over individual regions, the projections from MRI-AGCM3.2 spread over roughly 0.8 of the uncertainty range from the high-performing CMIP5 models compared to 0.4 of the range of the full ensemble.
中文翻译:
MRI-AGCM多累积方案和多SST集合与CMIP5多模型集合投影预测的土地降水气候区域特征比较
为制定区域气候变化的适应策略,越来越需要由高分辨率的一般环流模型(GCM)建立的气候变化预测的集合。气象研究所的大气GCM版本3.2(MRI-AGCM3.2),已在耦合模型比较项目第5阶段(CMIP5)中列出,通常以60 km和20 km的分辨率运行。MRI-AGCM3.2的集合由具有多个对流方案和未来海表温度的不同模式的成员组成,并与它们的缩减数据一起使用;但是,高分辨率集合的规模有限,可能会导致未来气候预测中出现不良的偏差和不确定性,从而限制其在气候变化和影响评估研究中的适当性和有效性。在这项研究中,为了全面了解使用MRI-AGCM3.2模拟的区域降水,我们研究了MRI-AGCM3.2如何很好地模拟了全球目前的区域降水,并比较了未来降水变化的不确定性和在MRI-AGCM3.2和CMIP5多海-海洋耦合GCM(AOGCM)集成之间改变投影本身。MRI-AGCM3.2降低了通过高性能CMIP5模型获得的区域平均降水的偏差,通过东亚和澳大利亚,青藏高原的偏差减少了约20%。当考虑26个全球陆地区域时,MRI-AGCM3.2比单个CMIP5模型在更多区域中实际模拟了空间格局和区域均值。至于未来的预测,在26个地区中的20个地区,在MRI-AGCM3.2集合与CMIP5多模型集合的第50个百分位数之间,年降水量变化的迹象相同。在热带南太平洋周围的其他六个地区,在有和没有大气-海洋耦合的情况下,建模的差异可能会影响预测。MRI-AGCM3.2产生的未来年降水量变化的不确定性部分重叠了所有地区CMIP5模型全部集合的最大-最小不确定性范围。此外,平均而言,MRI-AGCM3.2的投影分布在高性能CMIP5模型的不确定范围的约0.8,而整个集成范围的不确定度在0.4。在热带南太平洋周围的其他六个地区,在有和没有大气-海洋耦合的情况下,建模的差异可能会影响预测。MRI-AGCM3.2产生的未来年降水量变化的不确定性部分重叠了所有地区CMIP5模型全部集合的最大-最小不确定性范围。此外,平均而言,MRI-AGCM3.2的投影分布在高性能CMIP5模型的不确定范围的约0.8,而整个集成范围的不确定度在0.4。在热带南太平洋周围的其他六个地区,在有和没有大气-海洋耦合的情况下,建模的差异可能会影响预测。MRI-AGCM3.2产生的未来年降水量变化的不确定性部分重叠了所有地区CMIP5模型全部集合的最大-最小不确定性范围。此外,平均而言,MRI-AGCM3.2的投影分布在高性能CMIP5模型的不确定范围的约0.8,而整个集成范围的不确定度在0.4。2在所有区域中都与CMIP5模型的完整集合的最大最小不确定范围部分重叠。此外,平均而言,MRI-AGCM3.2的投影分布在高性能CMIP5模型的不确定范围的约0.8,而整个集成范围的不确定度在0.4。2在所有区域中都与CMIP5模型的完整集合的最大最小不确定范围部分重叠。此外,平均而言,MRI-AGCM3.2的投影分布在高性能CMIP5模型的不确定范围的约0.8,而整个集成范围的不确定度在0.4。


 京公网安备 11010802027423号