当前位置:
X-MOL 学术
›
Atmos. Environ.
›
论文详情
Our official English website, www.x-mol.net, welcomes your
feedback! (Note: you will need to create a separate account there.)
Quadrennial variability and trends of surface ozone across China during 2015–2018: A regional approach
Atmospheric Environment ( IF 4.2 ) Pub Date : 2021-01-01 , DOI: 10.1016/j.atmosenv.2020.117989 Ume Kalsoom , Tijian Wang , Chaoqun Ma , Lei Shu , Congwu Huang , Libo Gao
Atmospheric Environment ( IF 4.2 ) Pub Date : 2021-01-01 , DOI: 10.1016/j.atmosenv.2020.117989 Ume Kalsoom , Tijian Wang , Chaoqun Ma , Lei Shu , Congwu Huang , Libo Gao
|
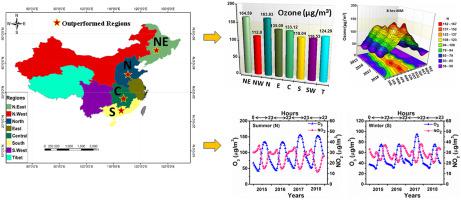
Abstract China has undergone headlong economic development, yielding a secondary air pollutant ‘ozone’, which has stirred up worldwide concerns. This study evaluates quadrennial, and seasonal surface ozone variations, ozone trends along with its significance through seasonal and deseasonal datasets, and ozone-NO2 correlation to codify a precedent for pollution control policies. China is divided into eight regions namely: Northeast (NE), Northwest (NW), North (N), East (E), Central (C), South (S), Southwest (SW), and Tibet (T), to exploit four-years data via (a) ozone 8-hr moving averages (O3-8hr), (b) hourly ozone monthly mean (O3-MM), (c) hourly ozone daily maximum MM (O3-DM-MM), (d) mean of the daily maximum 8-hr average ozone (MDA8-O3), (e) hourly ozone averages (O3-1hr), and (f) hourly NO2 averages (NO2-1hr), respectively. Quadrennial variations show distinct regions (i) Northeast with daily upraised value of 164.59 μg/m3, (ii) North possessing increased monthly variation of 125 μg/m3, and (iii) Tibet containing maximum yearly value of 79.81 μg/m3, respectively. Seasonal variations outpace North and South regions. The highest and lowest values of seasonal variations in North region are 135.61 μg/m3, and 23.96 μg/m3 during summer and winter, while maximum values of South region are 87.98 μg/m3 in autumn. In trend analysis, the seasonal dataset highlights higher ozone values during autumn, i.e. 74.12 μg/m3 and 141.96 μg/m3 for South and Central regions, respectively. In the meantime, the deseasonal dataset reveals the presence of increasing ozone trends in all studied regions. In assessing statistical significance by Mann-Kendall test, seasonal dataset rolls out statistically insignificant trends with an exception of South region. Meanwhile, deseasonal dataset projects statistically significant trends in all the eight regions. Lastly, two continual regions North and South are selected to determine ozone-NO2 relationship. The multiple analytical approaches unveil that O3 has increased by 20.86%, 14.05% and 12.64% in North, Central and South regions. The dissimilar climate, land cover modifications, precursors transportation and vehicular emissions might be some of the rationales to give rise to regional ozone variations. Therefore, we suggest revamping of emissions control policies and their precise implementation to abate ozone pollution.
更新日期:2021-01-01


 京公网安备 11010802027423号