Ecological Indicators ( IF 7.0 ) Pub Date : 2020-10-05 , DOI: 10.1016/j.ecolind.2020.106946 Samuel E. Cox , D. Terrance Booth , Robert D. Berryman
|
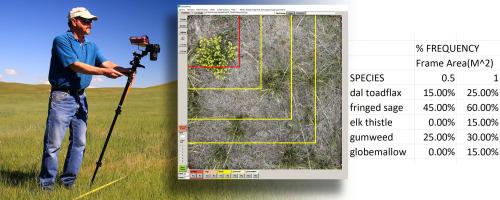
As our understanding of ecological systems grows, natural resource management becomes ever more dependent on timely, accurate, and inexpensively-collected monitoring data to support management decisions. Vegetation cover, density, and frequency are abundance metrics used in resource management; however, frequency data can be collected more quickly than density data and with more repeatability and less sensitivity to inter- and intra-seasonal variation in plant morphology. Moreover, frequency is perhaps the best method for monitoring invasive species across extensive areas. A limitation to the use of frequency data is that plot size affects frequency. The optimal plot size is one that yields measurements suitably removed from 0 or 100% to allow detection of both upward and downward frequency trends, yet the optimum plot size cannot be known before sampling. We addressed this conundrum by developing SampleFreq software that facilitates frequency measurements from digital nadir images of any scale with up to 10 nested plot sizes within the confines of the image dimensions. We conducted accuracy and agreement tests of the software using both artificial populations and field plots. Using artificial population plots, accuracy across all users was 93.4% with a repeatability coefficient of 1.4%, indicating high precision. In a field test, SampleFreq and standard field data averaged a 3.4% difference, and were within approximately 10.5% of each other 95% of the time. From the same field test, SampleFreq repeatability coefficient was 6.7%, while the field method was 4.3%, illustrating that both methods have relatively high precision. Because SampleFreq has high potential accuracy, high agreement with field data, and high precision across a range of users, we recommend using SampleFreq with nadir digital images as a suitable alternative method for monitoring plant frequency.
中文翻译:
使用SampleFreq从数字图像测量植物的嵌套频率
随着我们对生态系统的了解的增长,自然资源管理越来越依赖于及时,准确和廉价收集的监测数据来支持管理决策。植被覆盖度,密度和频率是资源管理中使用的丰度指标;但是,频率数据的采集速度比密度数据更快,并且可重复性更高,并且对植物形态的季节间和季节内变化的敏感性较低。此外,频率也许是监测大范围入侵物种的最佳方法。使用频率数据的局限性在于地块大小会影响频率。最佳地块大小是一种可以将测量值从0或100%适当移除的大小,从而可以检测向上和向下的频率趋势,但是,在采样之前无法得知最佳样区大小。我们通过开发SampleFreq软件解决了这个难题,该软件可以方便地从任意比例的数字最低点图像进行频率测量,并且在图像尺寸范围内最多可以嵌套10个样地。我们使用人工种群和现场图对软件进行了准确性和一致性测试。使用人工种群图,所有用户的准确性为93.4%,重复性系数为1.4%,表明准确性很高。在现场测试中,SampleFreq和标准现场数据平均相差3.4%,并且在95%的时间内彼此之间相差约10.5%。在相同的现场测试中,SampleFreq的重复性系数为6.7%,而现场方法为4.3%,说明这两种方法都具有较高的精度。


 京公网安备 11010802027423号