当前位置:
X-MOL 学术
›
Gondwana Res.
›
论文详情
Our official English website, www.x-mol.net, welcomes your feedback! (Note: you will need to create a separate account there.)
Updated Antarctic crustal model
Gondwana Research ( IF 6.1 ) Pub Date : 2021-01-01 , DOI: 10.1016/j.gr.2020.08.010 A. Baranov , R. Tenzer , A. Morelli
Gondwana Research ( IF 6.1 ) Pub Date : 2021-01-01 , DOI: 10.1016/j.gr.2020.08.010 A. Baranov , R. Tenzer , A. Morelli
|
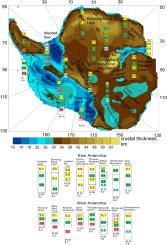
Abstract We use seismic data together with a subglacial bedrock relief from the BEDMAP2 database to obtain a new three-layer model of the consolidated (crystalline) crust of Antarctica that locally improves the global seismic crustal model CRUST1.0. We collect suitable data for constructing crustal layers, analyse them and build maps of the crustal layer thickness and seismic velocities. We use the subglacial relief according to a tectonic configuration and then interpolate data using a statistical kriging method. The P-wave velocity information from old seismic profiles have been supplemented with the new shear-wave velocity models. We adjust the thickness of crustal layers by multiplying a total crustal thickness by a percentage ratio of each individual layer at each point. Our results reveal large variations in seismic velocities between different crustal blocks forming Antarctica. The most pronounced differences exist between East and West Antarctica. In East Antarctica, a high P-wave velocity (vP > 7 km/s) layer in the lower crust is absent. The P-wave velocity in the lower crust changes from 6.1 km/s beneath the Lambert Rift to 6.9 km/s beneath the Wilkes Basin. In West Antarctica, a thick mafic lower crust is characterized by large P-wave velocities, ranging from 7.0 km/s under the Ross Sea to 7.3 km/s under the Byrd Basin. In contrast, velocities in the lower crust beneath the Transantarctic and Ellsworth-Whitmore Mountains are ~6.8 km/s. The P-wave velocities in the upper crust in East Antarctica are within the range 5.5–6.4 km/s. The upper crust of West Antarctica is characterized by the P-wave velocities of 5.6–6.3 km/s. The P-wave velocities in the middle crust vary within 5.9–6.6 km/s in East Antarctica and within 6.3–6.5 km/s in West Antarctica. A low-velocity layer (5.8–5.9 km/s) is detected at depth of ~20–25 km beneath the Princes Elizabeth Land.
中文翻译:

更新南极地壳模型
摘要 我们使用地震数据和 BEDMAP2 数据库中的冰下基岩地貌,获得了南极洲固结(结晶)地壳的三层模型,该模型局部改进了全球地震地壳模型 CRUST1.0。我们收集构建地壳层的合适数据,对其进行分析并绘制地壳层厚度和地震速度图。我们根据构造构造使用冰下地貌,然后使用统计克里金法对数据进行插值。新的横波速度模型补充了来自旧地震剖面的纵波速度信息。我们通过将总地壳厚度乘以每个点的每个单独层的百分比来调整地壳层的厚度。我们的结果揭示了形成南极洲的不同地壳块之间地震速度的巨大变化。东西南极洲之间存在最明显的差异。在东南极洲,下地壳不存在高 P 波速度 (vP > 7 km/s) 层。下地壳的 P 波速度从兰伯特裂谷下方的 6.1 公里/秒变为威尔克斯盆地下方的 6.9 公里/秒。在南极洲西部,厚基性下地壳的特点是 P 波速度大,范围从罗斯海下的 7.0 公里/秒到伯德盆地下的 7.3 公里/秒。相比之下,横贯南极和埃尔斯沃思-惠特莫尔山脉下方下地壳的速度约为 6.8 公里/秒。南极东部上地壳的 P 波速度在 5.5-6.4 km/s 范围内。西南极洲上地壳的特点是 P 波速度为 5.6-6.3 km/s。中地壳的 P 波速度在南极东部变化在 5.9-6.6 公里/秒内,在南极西部变化在 6.3-6.5 公里/秒内。在伊丽莎白王子土地下方约 20-25 公里的深度处检测到一个低速层(5.8-5.9 公里/秒)。
更新日期:2021-01-01
中文翻译:
更新南极地壳模型
摘要 我们使用地震数据和 BEDMAP2 数据库中的冰下基岩地貌,获得了南极洲固结(结晶)地壳的三层模型,该模型局部改进了全球地震地壳模型 CRUST1.0。我们收集构建地壳层的合适数据,对其进行分析并绘制地壳层厚度和地震速度图。我们根据构造构造使用冰下地貌,然后使用统计克里金法对数据进行插值。新的横波速度模型补充了来自旧地震剖面的纵波速度信息。我们通过将总地壳厚度乘以每个点的每个单独层的百分比来调整地壳层的厚度。我们的结果揭示了形成南极洲的不同地壳块之间地震速度的巨大变化。东西南极洲之间存在最明显的差异。在东南极洲,下地壳不存在高 P 波速度 (vP > 7 km/s) 层。下地壳的 P 波速度从兰伯特裂谷下方的 6.1 公里/秒变为威尔克斯盆地下方的 6.9 公里/秒。在南极洲西部,厚基性下地壳的特点是 P 波速度大,范围从罗斯海下的 7.0 公里/秒到伯德盆地下的 7.3 公里/秒。相比之下,横贯南极和埃尔斯沃思-惠特莫尔山脉下方下地壳的速度约为 6.8 公里/秒。南极东部上地壳的 P 波速度在 5.5-6.4 km/s 范围内。西南极洲上地壳的特点是 P 波速度为 5.6-6.3 km/s。中地壳的 P 波速度在南极东部变化在 5.9-6.6 公里/秒内,在南极西部变化在 6.3-6.5 公里/秒内。在伊丽莎白王子土地下方约 20-25 公里的深度处检测到一个低速层(5.8-5.9 公里/秒)。


 京公网安备 11010802027423号