Our official English website, www.x-mol.net, welcomes your
feedback! (Note: you will need to create a separate account there.)
Visual dimension analysis based on dimension subdivision
Journal of Visualization ( IF 1.7 ) Pub Date : 2020-09-21 , DOI: 10.1007/s12650-020-00694-3 Yi Zhang , Chenxi Yu , Ruoqi Wang , Xunhan Liu
Journal of Visualization ( IF 1.7 ) Pub Date : 2020-09-21 , DOI: 10.1007/s12650-020-00694-3 Yi Zhang , Chenxi Yu , Ruoqi Wang , Xunhan Liu
|
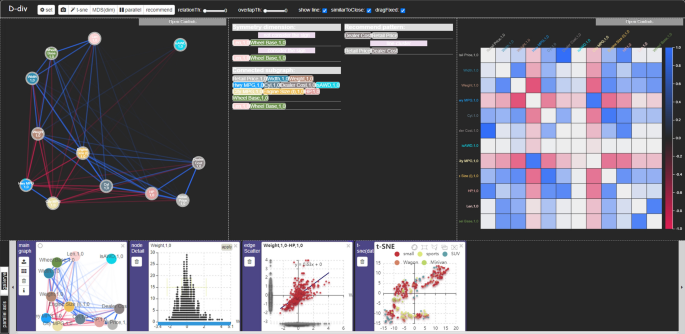
Visualization of multidimensional data has always been a research hotspot. Dimensional analysis is an efficient way to solve multidimensional problems. The current dimensional analysis methods mostly consider that all dimension correlations are at the same granularity, but actually the correlation between dimensions may be multi-scale. Multi-scale dimensions can also reflect the multi-scale data association mode, which is of certain value for analyzing the hidden information of multidimensional data. In this paper, we propose a method of dimension subdivision to resolve the multi-scale correlations between dimensions. To explore the multi-scale complex relationship between dimensions, we subdivide the original dimensions into finer sub-dimensions and build a graph-based data structure of the correlations to partition strongly relevant and irrelevant dimensions. We also proposed D-div, a visual dimension analysis system to support our method. In D-div, we provide visualization and interaction techniques to explore subdivided dimensions. Via case studies with two datasets, we demonstrate the effectiveness of our method of dimension subdivision.
中文翻译:

基于维度细分的可视化维度分析
多维数据的可视化一直是研究热点。维数分析是解决多维问题的有效方法。目前的维度分析方法大多认为所有维度相关性都在同一粒度,但实际上维度之间的相关性可能是多尺度的。多尺度维度也可以体现多尺度数据关联模式,对于分析多维数据的隐藏信息具有一定的价值。在本文中,我们提出了一种维度细分的方法来解决维度之间的多尺度相关性。探索维度之间的多尺度复杂关系,我们将原始维度细分为更精细的子维度,并构建基于图的相关性数据结构,以划分强相关和不相关的维度。我们还提出了 D-div,一个视觉维度分析系统来支持我们的方法。在 D-div 中,我们提供了可视化和交互技术来探索细分维度。通过两个数据集的案例研究,我们证明了我们的维度细分方法的有效性。
更新日期:2020-09-21
中文翻译:
基于维度细分的可视化维度分析
多维数据的可视化一直是研究热点。维数分析是解决多维问题的有效方法。目前的维度分析方法大多认为所有维度相关性都在同一粒度,但实际上维度之间的相关性可能是多尺度的。多尺度维度也可以体现多尺度数据关联模式,对于分析多维数据的隐藏信息具有一定的价值。在本文中,我们提出了一种维度细分的方法来解决维度之间的多尺度相关性。探索维度之间的多尺度复杂关系,我们将原始维度细分为更精细的子维度,并构建基于图的相关性数据结构,以划分强相关和不相关的维度。我们还提出了 D-div,一个视觉维度分析系统来支持我们的方法。在 D-div 中,我们提供了可视化和交互技术来探索细分维度。通过两个数据集的案例研究,我们证明了我们的维度细分方法的有效性。


 京公网安备 11010802027423号