Our official English website, www.x-mol.net, welcomes your
feedback! (Note: you will need to create a separate account there.)
Visual analytics and prediction system based on deep belief networks for icing monitoring data of overhead power transmission lines
Journal of Visualization ( IF 1.7 ) Pub Date : 2020-09-03 , DOI: 10.1007/s12650-020-00670-x Chi Zhang , Qing-wu Gong , Koji Koyamada
Journal of Visualization ( IF 1.7 ) Pub Date : 2020-09-03 , DOI: 10.1007/s12650-020-00670-x Chi Zhang , Qing-wu Gong , Koji Koyamada
|
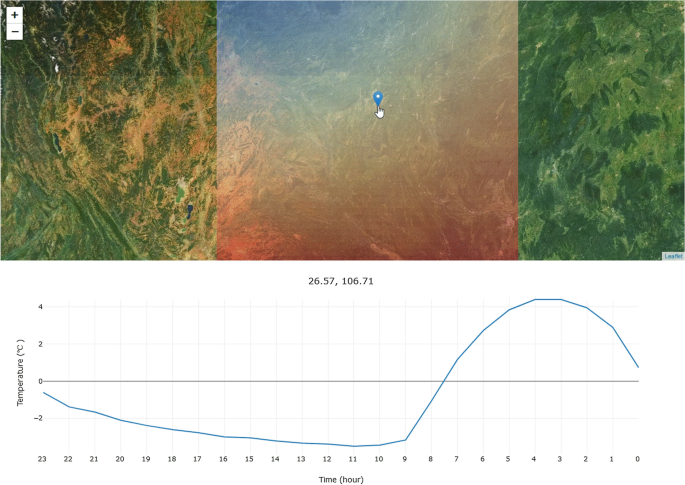
In this paper, a system is proposed for visualizing and analyzing icing monitoring data of power transmission lines. The distributions of temperature and humidity are visualized by two-dimensional maps with customizable map layers. The multi-dimensional monitoring data are visualized as parallel coordinates. Moreover, a prediction algorithm that is based on a hybrid deep belief network is integrated into the system for predicting the icing thickness. If the icing thickness of a certain location exceeds the threshold value, the historical meteorological data of the location can be visualized as line graphs, which helps to choose the appropriate de-icing measures. According to the experimental results, our system is capable of reflecting the statistical features of icing monitoring data with high accuracy of icing thickness prediction.
中文翻译:

基于深度置信网络的架空输电线路覆冰监测数据可视化分析与预测系统
在本文中,提出了一种用于可视化和分析输电线路覆冰监测数据的系统。温度和湿度的分布通过带有可自定义地图层的二维地图进行可视化。多维监测数据可视化为平行坐标。此外,基于混合深度置信网络的预测算法被集成到用于预测结冰厚度的系统中。如果某个地点的结冰厚度超过阈值,可以将该地点的历史气象数据可视化为折线图,有助于选择合适的除冰措施。根据实验结果,我们的系统能够反映结冰监测数据的统计特征,结冰厚度预测精度高。
更新日期:2020-09-03
中文翻译:
基于深度置信网络的架空输电线路覆冰监测数据可视化分析与预测系统
在本文中,提出了一种用于可视化和分析输电线路覆冰监测数据的系统。温度和湿度的分布通过带有可自定义地图层的二维地图进行可视化。多维监测数据可视化为平行坐标。此外,基于混合深度置信网络的预测算法被集成到用于预测结冰厚度的系统中。如果某个地点的结冰厚度超过阈值,可以将该地点的历史气象数据可视化为折线图,有助于选择合适的除冰措施。根据实验结果,我们的系统能够反映结冰监测数据的统计特征,结冰厚度预测精度高。


 京公网安备 11010802027423号