当前位置:
X-MOL 学术
›
Q. J. R. Meteorol. Soc.
›
论文详情
Our official English website, www.x-mol.net, welcomes your
feedback! (Note: you will need to create a separate account there.)
Representation of the Scandinavia–Greenland pattern and its relationship with the polar vortex in S2S forecast models
Quarterly Journal of the Royal Meteorological Society ( IF 3.0 ) Pub Date : 2020-08-15 , DOI: 10.1002/qj.3892 Simon H. Lee 1 , Andrew J. Charlton‐Perez 1 , Jason C. Furtado 2 , Steven J. Woolnough 1, 3
Quarterly Journal of the Royal Meteorological Society ( IF 3.0 ) Pub Date : 2020-08-15 , DOI: 10.1002/qj.3892 Simon H. Lee 1 , Andrew J. Charlton‐Perez 1 , Jason C. Furtado 2 , Steven J. Woolnough 1, 3
Affiliation
|
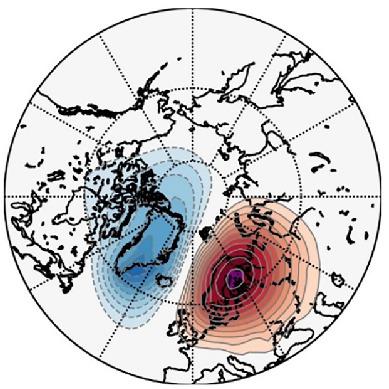
The strength of the stratospheric polar vortex is a key contributor to subseasonal prediction during boreal winter. Anomalously weak polar vortex events can be induced by enhanced vertically propagating Rossby waves from the troposphere, driven by blocking and wave breaking. Here, we analyse a tropospheric pattern—the Scandinavia–Greenland (S–G) pattern—associated with both processes. The S–G pattern is defined as the second empirical orthogonal function (EOF) of mean sea‐level pressure in the northeast Atlantic. The first EOF is a zonal pattern resembling the North Atlantic Oscillation. We show that the S–G pattern is associated with a transient amplification of planetary wavenumber 2 and meridional eddy heat flux, followed by the onset of a weakened polar vortex, which persists for the next two months. We then analyse 10 different models from the S2S database, finding that, while all models represent the structure of the S–G pattern well, some models have a zonal bias with more than the observed variability in their first EOF, and accordingly less in their second EOF. This bias is largest in the models with the lowest resolution. Skill in predicting the S–G pattern is not high beyond week 2 in any model, in contrast to the zonal pattern. We find that the relationship between the S–G pattern and enhanced eddy heat flux and a weakened polar vortex is initially well represented, but decays significantly with lead time in most S2S models. Our results motivate improved representation of the S–G pattern and its stratospheric response at longer lead times for improved subseasonal prediction of the stratospheric polar vortex.
中文翻译:

S2S预报模型中斯堪的纳维亚格陵兰模式的表示及其与极涡的关系
平流层极地涡旋的强度是北方冬季冬季季节预测的关键因素。异常弱的极地涡旋事件可能是由来自对流层的垂直传播的罗斯比波(由阻塞和波破碎驱动)引起的。在这里,我们分析了与这两个过程相关的对流层模式-斯堪的纳维亚-格陵兰(SG)模式。SG模式定义为东北大西洋平均海平面压力的第二个经验正交函数(EOF)。第一个EOF是类似于北大西洋涛动的纬向格局。我们表明,SG模式与2号行星波和子午涡热通量的瞬时放大有关,随后是弱磁极涡旋的开始,这种涡旋持续了两个月。然后,我们从S2S数据库中分析了10个不同的模型,发现尽管所有模型都很好地代表了S–G模式的结构,但某些模型的区域偏差较大,其第一个EOF的变化较大,因此,其EOF较小第二个EOF。在分辨率最低的模型中,此偏差最大。与分区模式相比,在任何模型中,预测S–G模式的技能在第二周后都不高。我们发现,SG模式与涡流热通量的增加以及极涡的减弱之间的关系最初得到了很好的体现,但是在大多数S2S模型中,其随提前时间而显着衰减。我们的结果促使在较长的交货时间内改进S-G模式及其平流层响应的表示,以改善平流层极涡的次季节预测。尽管所有模型都很好地表示了S–G模式的结构,但有些模型的区域偏差较大,其第一个EOF的变化较大,而第二个EOF的变化较小。在分辨率最低的模型中,此偏差最大。与区域模式相比,在任何模型中,预测S–G模式的技能在第二周后都不高。我们发现,SG模式和涡流热通量的增加以及极涡的减弱之间的关系一开始就可以很好地表示出来,但是在大多数S2S模型中,这种关系随着提前期而显着衰减。我们的结果促使在较长的交货时间内改进S-G模式及其平流层响应的表示,以改善平流层极涡的次季节预测。尽管所有模型都很好地表示了S–G模式的结构,但有些模型的区域偏差较大,其第一个EOF的变化较大,而第二个EOF的变化较小。在分辨率最低的模型中,此偏差最大。与区域模式相比,在任何模型中,预测S–G模式的技能在第二周后都不高。我们发现,SG模式和涡流热通量的增加以及极涡的减弱之间的关系一开始就可以很好地表示出来,但是在大多数S2S模型中,这种关系随着提前期而显着衰减。我们的结果促使在较长的交货时间内改进S-G模式及其平流层响应的表示,以改善平流层极涡的次季节预测。一些模型的区域偏差在其第一个EOF中具有大于观察到的变异性,因此在第二个EOF中具有较小的偏差。在分辨率最低的模型中,此偏差最大。与分区模式相比,在任何模型中,预测S–G模式的技能在第二周后都不高。我们发现,SG模式和涡流热通量的增加以及极涡的减弱之间的关系一开始就可以很好地表示出来,但是在大多数S2S模型中,这种关系随着提前期而显着衰减。我们的结果促使在较长的交货时间内改进S-G模式及其平流层响应的表示,以改善平流层极涡的次季节预测。一些模型的区域偏差在其第一个EOF中具有大于观察到的变异性,因此在第二个EOF中具有较小的偏差。在具有最低分辨率的模型中,此偏差最大。与分区模式相比,在任何模型中,预测S–G模式的技能在第二周后都不高。我们发现,SG模式和涡流热通量的增加以及极涡的减弱之间的关系一开始就可以很好地表示出来,但是在大多数S2S模型中,这种关系随着提前期而显着衰减。我们的结果促使在较长的交货时间内改进S-G模式及其平流层响应的表示,以改善平流层极涡的次季节预测。与区域模式相比,在任何模型中,预测S–G模式的技能在第二周后都不高。我们发现,SG模式和涡流热通量的增加以及极涡的减弱之间的关系一开始就可以很好地表示出来,但是在大多数S2S模型中,这种关系随着提前期而显着衰减。我们的结果促使在较长的交付时间内改进SG模式及其平流层响应的表示,以改善平流层极涡的亚季节预测。与区域模式相比,在任何模型中,预测S–G模式的技能在第二周后都不高。我们发现,SG模式与涡流热通量的增加以及极涡的减弱之间的关系最初得到了很好的体现,但是在大多数S2S模型中,其随提前时间而显着衰减。我们的结果促使在较长的交货时间内改进S-G模式及其平流层响应的表示,以改善平流层极涡的次季节预测。
更新日期:2020-08-15
中文翻译:
S2S预报模型中斯堪的纳维亚格陵兰模式的表示及其与极涡的关系
平流层极地涡旋的强度是北方冬季冬季季节预测的关键因素。异常弱的极地涡旋事件可能是由来自对流层的垂直传播的罗斯比波(由阻塞和波破碎驱动)引起的。在这里,我们分析了与这两个过程相关的对流层模式-斯堪的纳维亚-格陵兰(SG)模式。SG模式定义为东北大西洋平均海平面压力的第二个经验正交函数(EOF)。第一个EOF是类似于北大西洋涛动的纬向格局。我们表明,SG模式与2号行星波和子午涡热通量的瞬时放大有关,随后是弱磁极涡旋的开始,这种涡旋持续了两个月。然后,我们从S2S数据库中分析了10个不同的模型,发现尽管所有模型都很好地代表了S–G模式的结构,但某些模型的区域偏差较大,其第一个EOF的变化较大,因此,其EOF较小第二个EOF。在分辨率最低的模型中,此偏差最大。与分区模式相比,在任何模型中,预测S–G模式的技能在第二周后都不高。我们发现,SG模式与涡流热通量的增加以及极涡的减弱之间的关系最初得到了很好的体现,但是在大多数S2S模型中,其随提前时间而显着衰减。我们的结果促使在较长的交货时间内改进S-G模式及其平流层响应的表示,以改善平流层极涡的次季节预测。尽管所有模型都很好地表示了S–G模式的结构,但有些模型的区域偏差较大,其第一个EOF的变化较大,而第二个EOF的变化较小。在分辨率最低的模型中,此偏差最大。与区域模式相比,在任何模型中,预测S–G模式的技能在第二周后都不高。我们发现,SG模式和涡流热通量的增加以及极涡的减弱之间的关系一开始就可以很好地表示出来,但是在大多数S2S模型中,这种关系随着提前期而显着衰减。我们的结果促使在较长的交货时间内改进S-G模式及其平流层响应的表示,以改善平流层极涡的次季节预测。尽管所有模型都很好地表示了S–G模式的结构,但有些模型的区域偏差较大,其第一个EOF的变化较大,而第二个EOF的变化较小。在分辨率最低的模型中,此偏差最大。与区域模式相比,在任何模型中,预测S–G模式的技能在第二周后都不高。我们发现,SG模式和涡流热通量的增加以及极涡的减弱之间的关系一开始就可以很好地表示出来,但是在大多数S2S模型中,这种关系随着提前期而显着衰减。我们的结果促使在较长的交货时间内改进S-G模式及其平流层响应的表示,以改善平流层极涡的次季节预测。一些模型的区域偏差在其第一个EOF中具有大于观察到的变异性,因此在第二个EOF中具有较小的偏差。在分辨率最低的模型中,此偏差最大。与分区模式相比,在任何模型中,预测S–G模式的技能在第二周后都不高。我们发现,SG模式和涡流热通量的增加以及极涡的减弱之间的关系一开始就可以很好地表示出来,但是在大多数S2S模型中,这种关系随着提前期而显着衰减。我们的结果促使在较长的交货时间内改进S-G模式及其平流层响应的表示,以改善平流层极涡的次季节预测。一些模型的区域偏差在其第一个EOF中具有大于观察到的变异性,因此在第二个EOF中具有较小的偏差。在具有最低分辨率的模型中,此偏差最大。与分区模式相比,在任何模型中,预测S–G模式的技能在第二周后都不高。我们发现,SG模式和涡流热通量的增加以及极涡的减弱之间的关系一开始就可以很好地表示出来,但是在大多数S2S模型中,这种关系随着提前期而显着衰减。我们的结果促使在较长的交货时间内改进S-G模式及其平流层响应的表示,以改善平流层极涡的次季节预测。与区域模式相比,在任何模型中,预测S–G模式的技能在第二周后都不高。我们发现,SG模式和涡流热通量的增加以及极涡的减弱之间的关系一开始就可以很好地表示出来,但是在大多数S2S模型中,这种关系随着提前期而显着衰减。我们的结果促使在较长的交付时间内改进SG模式及其平流层响应的表示,以改善平流层极涡的亚季节预测。与区域模式相比,在任何模型中,预测S–G模式的技能在第二周后都不高。我们发现,SG模式与涡流热通量的增加以及极涡的减弱之间的关系最初得到了很好的体现,但是在大多数S2S模型中,其随提前时间而显着衰减。我们的结果促使在较长的交货时间内改进S-G模式及其平流层响应的表示,以改善平流层极涡的次季节预测。


 京公网安备 11010802027423号