当前位置:
X-MOL 学术
›
Int. J. Climatol.
›
论文详情
Our official English website, www.x-mol.net, welcomes your
feedback! (Note: you will need to create a separate account there.)
Regionalization of evapotranspiration in India using fuzzy dynamic clustering approach. Part 2: Applications of regions
International Journal of Climatology ( IF 3.5 ) Pub Date : 2020-07-27 , DOI: 10.1002/joc.6773 Swapan Kumar Masanta 1 , Vemavarapu Venkata Srinivas 1, 2
International Journal of Climatology ( IF 3.5 ) Pub Date : 2020-07-27 , DOI: 10.1002/joc.6773 Swapan Kumar Masanta 1 , Vemavarapu Venkata Srinivas 1, 2
Affiliation
|
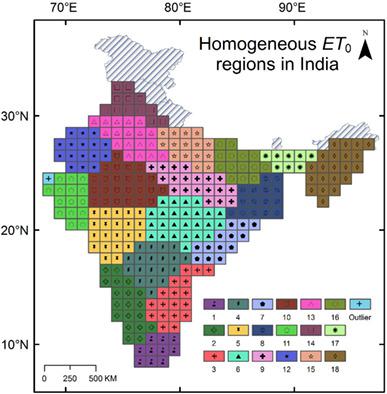
Accurate estimation of ET0, and determination of its trend/variability and sensitivity to changes in climate variables is essential at regional scale for different applications. These are attempted for India by considering 18 homogeneous ET0 regions formed in companion paper. Food and Agriculture Organization (FAO) recommends Penman–Monteith (PM) equation for ET0 estimation, which requires information on several climate variables. The equation cannot be used in data‐sparse areas where information/forecasts on one or more required climate variables is unavailable/unreliable. To address this, relevance vector regression (RVR) relationships are developed in this paper for the 18 homogeneous regions to arrive at FAO‐PM estimate of ET0 from subsets of its predictor climate variables, which could be typically expected in data‐sparse areas. The developed relationships are shown to be better in arriving at ET0 estimates when compared to multiple linear regression (MLR) relationships and three widely used empirical equations (Hargreaves, Mcguinness–Bordne, Priestly–Taylor). Regional trend analysis revealed that ET0 is significantly decreasing (increasing) in most regions located in north (south) India. Sensitivity of ET0 and surface runoff to changes in their predictor climate variables is determined for each region by considering third‐order Taylor series approximation of their functional relationships. Key climate variable(s) that govern ET0 changes in each region are identified. Results indicate that at annual scale solar radiation and relative humidity govern ET0 changes in regions located in south and north‐east India, whereas wind speed followed by relative humidity mostly influence the ET0 changes over other regions. Existence of evaporation paradox in four regions and validity of Bouchet's complementary relationship between ET0, actual evapotranspiration (ETa), and precipitation in 11 regions is also established. Significant divergence in trend of ET0 and ETa was evident in north‐east India.
中文翻译:

利用模糊动态聚类方法对印度的蒸散量进行区域划分。第2部分:区域的应用
准确估算ET 0并确定其趋势/变异性以及对气候变量变化的敏感性,对于不同的应用在区域范围内至关重要。通过考虑在随行文件中形成的18个均匀ET 0区域,对印度进行了尝试。粮食及农业组织(FAO)建议ET 0的Penman–Monteith(PM)方程估计,这需要有关几个气候变量的信息。在无法获得/不可靠有关一个或多个所需气候变量的信息/预测的数据稀疏区域中,不能使用该方程。为了解决这个问题,本文针对18个同质区域开发了相关矢量回归(RVR)关系,以从其预测气候变量的子集得出ET 0的FAO-PM估计值,这在数据稀疏地区通常是可以预期的。与多重线性回归(MLR)关系和三个广泛使用的经验方程式(Hargreaves,Mcguinness-Bordne,Priestly-Taylor)相比,已发展的关系被证明在ET 0估计方面更好。区域趋势分析表明在印度北部(南部)的大多数地区,ET 0显着下降(增加)。通过考虑每个函数关系的三阶泰勒级数逼近,确定每个地区的ET 0和地表径流对其预报气候变量变化的敏感性。确定了控制每个区域ET 0变化的关键气候变量。结果表明,在印度南部和东北部地区,太阳辐射和相对湿度在年尺度上控制着ET 0的变化,而风速和随后的相对湿度主要影响ET 0。在其他地区的变化。还建立了四个地区蒸发悖论的存在以及ET 0,实际蒸散量(ET a)和降水在11个地区之间的Bouchet互补关系的有效性。在印度东北部,ET 0和ET a的趋势差异明显。
更新日期:2020-07-27
中文翻译:
利用模糊动态聚类方法对印度的蒸散量进行区域划分。第2部分:区域的应用
准确估算ET 0并确定其趋势/变异性以及对气候变量变化的敏感性,对于不同的应用在区域范围内至关重要。通过考虑在随行文件中形成的18个均匀ET 0区域,对印度进行了尝试。粮食及农业组织(FAO)建议ET 0的Penman–Monteith(PM)方程估计,这需要有关几个气候变量的信息。在无法获得/不可靠有关一个或多个所需气候变量的信息/预测的数据稀疏区域中,不能使用该方程。为了解决这个问题,本文针对18个同质区域开发了相关矢量回归(RVR)关系,以从其预测气候变量的子集得出ET 0的FAO-PM估计值,这在数据稀疏地区通常是可以预期的。与多重线性回归(MLR)关系和三个广泛使用的经验方程式(Hargreaves,Mcguinness-Bordne,Priestly-Taylor)相比,已发展的关系被证明在ET 0估计方面更好。区域趋势分析表明在印度北部(南部)的大多数地区,ET 0显着下降(增加)。通过考虑每个函数关系的三阶泰勒级数逼近,确定每个地区的ET 0和地表径流对其预报气候变量变化的敏感性。确定了控制每个区域ET 0变化的关键气候变量。结果表明,在印度南部和东北部地区,太阳辐射和相对湿度在年尺度上控制着ET 0的变化,而风速和随后的相对湿度主要影响ET 0。在其他地区的变化。还建立了四个地区蒸发悖论的存在以及ET 0,实际蒸散量(ET a)和降水在11个地区之间的Bouchet互补关系的有效性。在印度东北部,ET 0和ET a的趋势差异明显。


 京公网安备 11010802027423号