当前位置:
X-MOL 学术
›
Int. J. Climatol.
›
论文详情
Our official English website, www.x-mol.net, welcomes your
feedback! (Note: you will need to create a separate account there.)
Spatial distribution of spectral SST oscillations over the equatorial pacific in the period 1888–2014
International Journal of Climatology ( IF 3.5 ) Pub Date : 2020-07-27 , DOI: 10.1002/joc.6774 Carlos Batista Silva 1 , Maria Elisa Siqueira Silva 1 , Tércio Ambrizzi 2 , Natália Nunes Patucci 1 , Bruna Simões Lima 1 , Wesley Campos Correa 3
International Journal of Climatology ( IF 3.5 ) Pub Date : 2020-07-27 , DOI: 10.1002/joc.6774 Carlos Batista Silva 1 , Maria Elisa Siqueira Silva 1 , Tércio Ambrizzi 2 , Natália Nunes Patucci 1 , Bruna Simões Lima 1 , Wesley Campos Correa 3
Affiliation
|
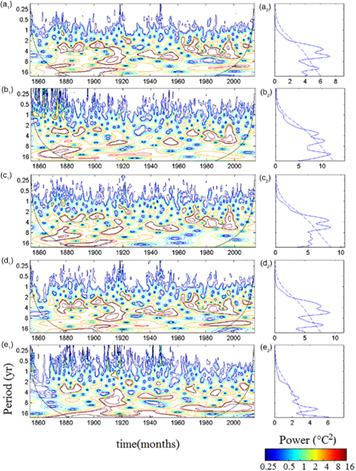
This study identified and analysed the spatial and temporal patterns of spectral oscillation ranges of the monthly sea surface temperature, SST, over the tropical Pacific region, from 1888 to 2014, through wavelet analysis. The strategic steps considered the variance analysis, obtained from the wavelet computation, for each single grid point instead of the analysis of a spatial mean variance, as is commonly done, allowing us to visualize the spatial distribution of SST variance during different time periods. The mean results indicate that lower-frequency oscillations (2–4 and 4–8 years) over the considered area are becoming more intense while higher-frequency oscillations (1–12 months) are becoming less intense through time, which can lead to more persistent climates around the globe. While the 1–2 year oscillations feature the highest positive trend along the equatorial belt over central and eastern locations, the 4–8 year oscillations feature the strongest signal closer to the western South American coast, and the 2–4 year oscillations present positive signals over areas closer to the continental coast and over more distant western locations intercalated by negative signals. Throughout time, the position of the highest EN signals occurs either over central or eastern areas of the equatorial Pacific. The SST variance in the Niño areas mainly oscillates within the 2–4 and 4–8 year spectral ranges. Niño1 + 2 and Niño3 regions, in opposition to Niño3 and Niño3 + 4 regions, present the highest SST variance values for the four considered spectral ranges. The strongest El Niño events present their main oscillations in the 2–4 and 4–8 year spectral ranges, especially in the Niño1 + 2 and Niño3 regions, while weaker El Niño events show more association with the 1–2 year spectral range. Although there are some patterns identified for distinct El Niño/Southern Oscillation, ENSO, intensities and the associated frequency oscillations, the distinct spatial spectral energy distribution over the equatorial areas suggests the importance of the spatial distribution of the spectral energy through time in order to better characterize the ENSO events.
中文翻译:

1888-2014 年赤道太平洋海温光谱振荡的空间分布
本研究通过小波分析识别并分析了 1888 年至 2014 年热带太平洋地区每月海面温度 SST 的光谱振荡范围的时空模式。战略步骤考虑了从小波计算获得的方差分析,对于每个单个网格点,而不是像通常所做的那样对空间平均方差进行分析,使我们能够可视化不同时间段内 SST 方差的空间分布。平均结果表明,所考虑区域的低频振荡(2-4 年和 4-8 年)变得更加强烈,而高频振荡(1-12 个月)随着时间的推移变得不那么强烈,这可能导致更多全球持续的气候。虽然 1-2 年的振荡在赤道带中部和东部地区具有最高的正趋势,但 4-8 年的振荡在靠近南美西部海岸的地方具有最强的信号,并且 2-4 年的振荡呈现出积极的信号在更靠近大陆海岸的地区和更远的西部地区,夹杂着负面信号。随着时间的推移,最高 EN 信号的位置出现在赤道太平洋的中部或东部地区。Niño 区的海温变化主要在 2-4 年和 4-8 年的光谱范围内振荡。Niño1+2 和 Niño3 区域与 Niño3 和 Niño3+4 区域相反,在四个考虑的光谱范围内呈现最高的 SST 方差值。最强的厄尔尼诺事件主要在 2-4 年和 4-8 年的光谱范围内出现振荡,尤其是在 Niño1+2 和 Niño3 区域,而较弱的厄尔尼诺事件则显示出与 1-2 年光谱范围的更多关联。尽管已经确定了不同的厄尔尼诺/南方涛动、ENSO、强度和相关频率振荡的一些模式,但赤道地区不同的空间光谱能量分布表明光谱能量随时间的空间分布的重要性,以便更好地表征 ENSO 事件。
更新日期:2020-07-27
中文翻译:
1888-2014 年赤道太平洋海温光谱振荡的空间分布
本研究通过小波分析识别并分析了 1888 年至 2014 年热带太平洋地区每月海面温度 SST 的光谱振荡范围的时空模式。战略步骤考虑了从小波计算获得的方差分析,对于每个单个网格点,而不是像通常所做的那样对空间平均方差进行分析,使我们能够可视化不同时间段内 SST 方差的空间分布。平均结果表明,所考虑区域的低频振荡(2-4 年和 4-8 年)变得更加强烈,而高频振荡(1-12 个月)随着时间的推移变得不那么强烈,这可能导致更多全球持续的气候。虽然 1-2 年的振荡在赤道带中部和东部地区具有最高的正趋势,但 4-8 年的振荡在靠近南美西部海岸的地方具有最强的信号,并且 2-4 年的振荡呈现出积极的信号在更靠近大陆海岸的地区和更远的西部地区,夹杂着负面信号。随着时间的推移,最高 EN 信号的位置出现在赤道太平洋的中部或东部地区。Niño 区的海温变化主要在 2-4 年和 4-8 年的光谱范围内振荡。Niño1+2 和 Niño3 区域与 Niño3 和 Niño3+4 区域相反,在四个考虑的光谱范围内呈现最高的 SST 方差值。最强的厄尔尼诺事件主要在 2-4 年和 4-8 年的光谱范围内出现振荡,尤其是在 Niño1+2 和 Niño3 区域,而较弱的厄尔尼诺事件则显示出与 1-2 年光谱范围的更多关联。尽管已经确定了不同的厄尔尼诺/南方涛动、ENSO、强度和相关频率振荡的一些模式,但赤道地区不同的空间光谱能量分布表明光谱能量随时间的空间分布的重要性,以便更好地表征 ENSO 事件。


 京公网安备 11010802027423号