当前位置:
X-MOL 学术
›
Remote Sens. Ecol. Conserv.
›
论文详情
Our official English website, www.x-mol.net, welcomes your
feedback! (Note: you will need to create a separate account there.)
Combining optical and radar satellite image time series to map natural vegetation: savannas as an example
Remote Sensing in Ecology and Conservation ( IF 3.9 ) Pub Date : 2020-01-17 , DOI: 10.1002/rse2.139 Mailys Lopes 1, 2, 3 , Pierre‐Louis Frison 3 , Sarah M. Durant 1 , Henrike Schulte to Bühne 1 , Audrey Ipavec 1 , Vincent Lapeyre 4 , Nathalie Pettorelli 1
Remote Sensing in Ecology and Conservation ( IF 3.9 ) Pub Date : 2020-01-17 , DOI: 10.1002/rse2.139 Mailys Lopes 1, 2, 3 , Pierre‐Louis Frison 3 , Sarah M. Durant 1 , Henrike Schulte to Bühne 1 , Audrey Ipavec 1 , Vincent Lapeyre 4 , Nathalie Pettorelli 1
Affiliation
|
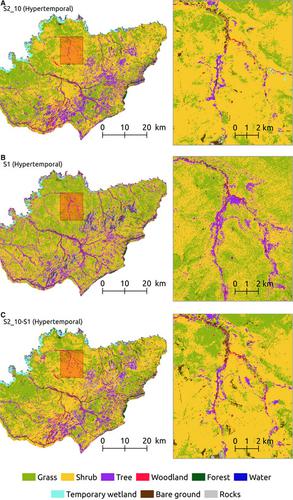
Up‐to‐date land cover maps are important for biodiversity monitoring as they are central to habitat and ecosystem distribution assessments. Satellite remote sensing is a key technology for generating these maps. Until recently, land cover mapping has been limited to static approaches, which have primarily led to the production of either global maps at coarse spatial resolutions or geographically restricted maps at high spatial resolutions. The recent availability of optical (Sentinel‐2) and radar (Sentinel‐1) satellite image time series (SITS) which provide access to high spatial and very high temporal resolutions, is a game changer, offering opportunities to map land cover using both temporal and spatial information. These data moreover open interesting perspectives for land cover mapping based on data combination approach. However, the usefulness of combining dense time series (more than 30 images per year) and data combination approaches to map natural vegetation has so far not been assessed. To address this gap, this contribution tests the idea that the combined consideration of optical and radar data combination and time series analyses can significantly improve natural vegetation mapping in the Pendjari National Park, a Sahelian savanna protected area in Benin. Results highlight that the combination of Sentinel‐1 and Sentinel‐2 SITS performs as well as Sentinel‐2 SITS alone in terms of classification accuracy. Land cover maps are however qualitatively better when considering the data combination approach. Our results also clearly show that the use of dense/hypertemporal optical time series significantly improves classification outcomes compared to using multitemporal only a few images per year) or monotemporal data. Altogether, this work thus demonstrates the ability of dense SITS to improve discrimination of natural vegetation types using information on their phenology, leading to more detailed and more reliable maps for environmental management.
中文翻译:

结合光学和雷达卫星图像时间序列来绘制自然植被图:以稀树草原为例
最新的土地覆盖图对于生物多样性监测非常重要,因为它们对于栖息地和生态系统分布评估至关重要。卫星遥感是生成这些地图的关键技术。直到最近,土地覆盖制图还仅限于静态方法,这主要导致以粗略的空间分辨率生成全局地图或以高的空间分辨率生成地理位置受限的地图。光学(Sentinel-2)和雷达(Sentinel-1)卫星图像时间序列(SITS)的最新可用性可提供对高空间和非常高的时间分辨率的访问权限,这改变了游戏规则,并提供了同时使用时间和地形图绘制土地覆盖图的机会和空间信息。这些数据还为基于数据组合方法的土地覆被测绘开辟了有趣的前景。然而,迄今为止,尚未评估将密集的时间序列(每年超过30张图像)与数据组合方法相结合来绘制自然植被的有用性。为了解决这一差距,这项贡献检验了以下想法:光学和雷达数据组合以及时间序列分析的综合考虑可以大大改善贝宁萨赫勒热带稀树草原保护区Pendjari国家公园的自然植被测绘。结果突出表明,就分类准确度而言,Sentinel-1和Sentinel-2 SITS的组合性能仅与Sentinel-2 SITS相同。但是,在考虑数据组合方法时,土地覆盖图在质量上要好一些。我们的结果还清楚地表明,与仅使用多时态(每年仅几张图像)或单时态数据相比,使用密集/时空光学时间序列可以显着改善分类结果。总而言之,这项工作证明了密集的SITS可以利用物候物候信息来改善对自然植被类型的辨别能力,从而为环境管理提供更详细,更可靠的地图。
更新日期:2020-01-17
中文翻译:
结合光学和雷达卫星图像时间序列来绘制自然植被图:以稀树草原为例
最新的土地覆盖图对于生物多样性监测非常重要,因为它们对于栖息地和生态系统分布评估至关重要。卫星遥感是生成这些地图的关键技术。直到最近,土地覆盖制图还仅限于静态方法,这主要导致以粗略的空间分辨率生成全局地图或以高的空间分辨率生成地理位置受限的地图。光学(Sentinel-2)和雷达(Sentinel-1)卫星图像时间序列(SITS)的最新可用性可提供对高空间和非常高的时间分辨率的访问权限,这改变了游戏规则,并提供了同时使用时间和地形图绘制土地覆盖图的机会和空间信息。这些数据还为基于数据组合方法的土地覆被测绘开辟了有趣的前景。然而,迄今为止,尚未评估将密集的时间序列(每年超过30张图像)与数据组合方法相结合来绘制自然植被的有用性。为了解决这一差距,这项贡献检验了以下想法:光学和雷达数据组合以及时间序列分析的综合考虑可以大大改善贝宁萨赫勒热带稀树草原保护区Pendjari国家公园的自然植被测绘。结果突出表明,就分类准确度而言,Sentinel-1和Sentinel-2 SITS的组合性能仅与Sentinel-2 SITS相同。但是,在考虑数据组合方法时,土地覆盖图在质量上要好一些。我们的结果还清楚地表明,与仅使用多时态(每年仅几张图像)或单时态数据相比,使用密集/时空光学时间序列可以显着改善分类结果。总而言之,这项工作证明了密集的SITS可以利用物候物候信息来改善对自然植被类型的辨别能力,从而为环境管理提供更详细,更可靠的地图。


 京公网安备 11010802027423号