Austral Ecology ( IF 1.6 ) Pub Date : 2020-07-21 , DOI: 10.1111/aec.12931 Benjamin Mayne 1 , Oliver Berry 1 , Simon Jarman 2
|
Mortality rates, life expectancy, longevity (life expectancy at birth) and maximum lifespan are key parameters describing the dynamics of wild animal populations. Estimates of their values enable assessment of extinction risk (Force 2008), the rate of spread of invasive species (Tabak et al. 2018) or sustainable harvest (Ziegler et al. 2016). The definition for mortality rates is well established (Deevey 1947). However, the published standard practice for the derivation of life expectancy and maximum lifespan for wildlife potentially suffers from several biases.
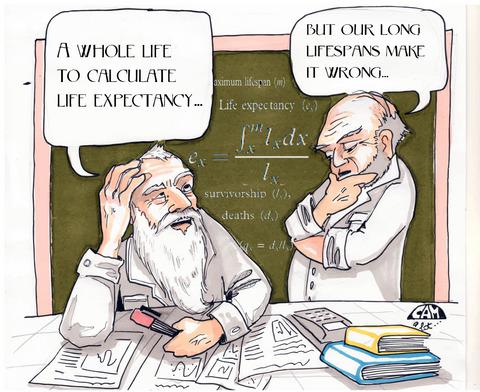
 ) are the deaths (dx), the survivorship (lx), the successive subtraction of deaths and mortality rates (qx) the fraction of individuals that died and survived within that age interval (qx = dx/lx). Life expectancy (ex) at a given age is the mean remaining maximum lifespan (m). Therefore, life expectancy for any given age can be determined by the fraction of the area under the survivorship curve from
  to maximum lifespan and the survivorship at
  (Deevey 1947).
In the wildlife ecology literature for calculation of ex, the upper limit or m is typically a point value representing the maximum age at death recorded within the life table. However, the choice of value is important since it may be inflated by outliers; or in under‐sampled populations, maximum age individuals will not be recorded. For a population under weak environmental pressures such as in captivity, longevity may be artificially inflated. This tends to skew ex, towards values that are unrealistic for wild populations. A further problem with using a point value for m is that because observations of older animals are typically scarce, its commonplace to substitute a value from the literature (Tacutu et al. 2018). This ignores that individual populations may have unique life expectancies and maximum lifespans.
Instead of using a point value for the highest recorded x for m, the problems identified above can be addressed by estimating x from the survivorship distribution. In human populations, this has been achieved with Weibull, Gompertz or log‐normal distributions (Moser et al. 2015). Once the best fit model has been determined, using the upper confidence interval range as the definition for lifespan (m95%), a life expectancy estimate can be obtained by considering 95% of the data. For example, if we consider a life table from a population of female Northern Muriquis (Brachyteles hypoxanthus), the maximum recorded age is 42 years (Fig. 1a; Bronikowski et al. 2016). Naturally, one might say the maximum lifespan for this population is 42 years, and however, using m95% (where N = 176) we can define the maximum lifespan as m95% = 39.6 years. From here, m95% can be used to estimate life expectancy from birth, providing a value that does not rely on the longevity of one individual. Another example using a population of bottlenose dolphins (Tursiops truncates; Stolen & Barlow 2003) results in a similar  (9.6 years) and
  (9.7 years, where N = 1000), but a considerably lower wild lifespan estimate than has been observed in captivity (35 years) indicating the inappropriateness of substituting value from captive animals (Fig. 1b).

 years, 1.1 years lower than using the maximum age recorded (
 years). The AnAge lifespan value is from a wild population of Northern Muriquis. (b) A wild population of bottlenose dolphins (Stolen & Barlow 2003), the life expectancy estimated using m95% was
  years, 0.1 years lower than using the maximum age recorded
  years, but significantly lower than the point value for maximum lifespan in the AnAge Database based on a captive animal.
 This method can be used wherever life tables are available for species or individual populations. Life tables can be readily constructed if a methodology of ageing exists either through individual marking, morphological indices (Eaton & Link 2011) or through epigenetics by measuring DNA methylation (De Paoli‐Iseppi et al. 2019). In Appendix S1, we have provided further population‐specific examples of the estimation of m95% and  for long‐lived species from five vertebrate classes, including the African Elephant, Black‐legged kittiwake, Freshwater crocodile, American bullfrog and Sockeye salmon. The supplementary tables demonstrate firstly that the maximum lifespan, which in all studies is recorded as the oldest individual, differs greatly among populations of the same species. The corollary of is that secondly, populations may have significantly different life expectancies, which highlights that substituting lifespan values across populations may introduce significant bias.
In conclusion, we have demonstrated a method to estimate life expectancy from a population’s full dataset rather than a point value from a single long‐lived individual. A population‐based maximum lifespan estimate is also compatible with population age distribution estimates made by cross‐sectional sampling, rather than the longitudinal sampling required for life tables. These population age structures can be generated for many animals at a single time point from incremental features like fish otoliths and are becoming increasingly feasible from specialised genomic analyses (De Paoli‐Iseppi et al. 2017). The definitions of maximum lifespan and longevity that we give here along with population age distributions can be used to give less biased approaches for wildlife management.
中文翻译:
重新定义寿命和野生动物管理的最大寿命
死亡率,预期寿命,寿命(出生时的预期寿命)和最大寿命是描述野生动物种群动态的关键参数。它们的值的估计使灭绝危险(强制评估2008年),入侵物种的蔓延速度(塔巴克等人。2018(齐格勒)或可持续收获等人。2016)。死亡率的定义是公认的(Deevey 1947)。但是,已公布的用于推导野生动物的预期寿命和最大寿命的标准做法可能会受到一些偏见的困扰。
)的生命表的主要特征是死亡(d x),生存率(l x),相继减去死亡数和死亡率(q x)在该年龄范围内死亡和存活的个体的比例该年龄间隔(q x = d x / l x)。给定年龄的预期寿命(e x)是平均剩余最大寿命(m)。因此,任何给定年龄的预期寿命都可以通过生存曲线下的面积(从最大寿命到生存时间)的比例来确定(Deevey 1947)。在用于计算e x的野生生物生态学文献中,上限或m通常是一个点值,代表生命表中记录的最大死亡年龄。但是,价值的选择很重要,因为离群值可能会夸大价值。或在抽样不足的人群中,不会记录最大年龄的个人。对于处于诸如囚禁之类的弱环境压力下的人口,寿命可能被人为地夸大了。这倾向于使e x偏向野生种群不现实的值。使用m的点值的另一个问题是,由于通常不会观察到较大的动物,因此通常用文献中的值代替(Tacutu等。2018)。这忽略了个体人口可能具有独特的预期寿命和最大寿命。
代替使用用于记录的最高的点值的X为米,上述问题可以通过估计来解决X从存活率分布。在人类中,这是通过Weibull,Gompertz或对数正态分布实现的(Moser等人,2015年)。一旦确定了最佳拟合模型,就使用上限置信区间范围作为寿命的定义(m 95%),可以通过考虑95%的数据来获得预期寿命估计。例如,如果我们考虑来自北部女性Muriquis(Brachyteles hypoxanthus)的生命表),最大记录年龄为42岁(图1A; Bronikowski等人。2016)。自然,也许有人会说此人群的最大寿命为42年,但是,使用m 95%(其中N = 176),我们可以将最大寿命定义为m 95% = 39.6年。从此处开始,可以使用m 95%来估计出生时的预期寿命,其提供的值不依赖于个人的寿命。另一个使用宽吻海豚种群的例子(Tursiops截短; Stolen&Barlow 2003)得出相似的结果(9.6年)和(9.7年,其中N = 1000),但野生寿命估计值比人工饲养(35年)观察到的要低得多,这表明用人工饲养的动物替代价值是不合适的(图1b)。
年,1.1岁比使用记录(最大年龄降低 岁)。AnAge寿命值来自北部Muriquis的野生种群。(b)宽吻海豚的野生种群(Stolen&Barlow 2003),使用95%的m估计的预期寿命为 几年,比使用记录的最大年龄 低0.1年,但明显低于最大寿命的点值。基于圈养动物的AnAge数据库。只要有适用于物种或个体种群的生命表,就可以使用此方法。寿命表可以如果老化的方法既可以通过单独的标记,形态指数(伊顿&连接存在容易地构建2011通过测量DNA甲基化(德佩奥利-Iseppi)或通过表观遗传学等人。2019)。在附录S1中,我们提供了针对特定人群的m 95%和适用于五种脊椎动物类别中的长寿命物种,包括非洲大象,黑脚基蒂鲸,淡水鳄鱼,美洲牛蛙和红鲑。补充表首先表明,在所有物种中,最大寿命(在所有研究中均记录为最老的个体)差异很大。其推论是,其次,人群的预期寿命可能存在显着差异,这突出表明,跨人群替换寿命值可能会带来显着的偏差。
总之,我们展示了一种从总体人口数据集而不是单个长寿个体的点数中估计寿命的方法。基于人口的最大寿命估算值也与通过横截面抽样而不是寿命表所需的纵向抽样得出的人口年龄分布估算值兼容。这些种群年龄结构可以在单个时间点通过诸如鱼耳石之类的增量特征生成,并且通过专门的基因组分析变得越来越可行(De Paoli-Iseppi等人,2017年)。我们在此给出的最大寿命和寿命定义以及种群年龄分布可用于为野生动植物管理提供较少偏见的方法。


 京公网安备 11010802027423号