当前位置:
X-MOL 学术
›
Biotechnol. Bioeng.
›
论文详情
Our official English website, www.x-mol.net, welcomes your
feedback! (Note: you will need to create a separate account there.)
Characterization of lysozyme PEGylation products using polarized excitation-emission matrix spectroscopy.
Biotechnology and Bioengineering ( IF 3.5 ) Pub Date : 2020-07-07 , DOI: 10.1002/bit.27483 Ana Luiza de Faria E Silva 1 , Saioa Elcoroaristizabal 1 , Alan George Ryder 1
Biotechnology and Bioengineering ( IF 3.5 ) Pub Date : 2020-07-07 , DOI: 10.1002/bit.27483 Ana Luiza de Faria E Silva 1 , Saioa Elcoroaristizabal 1 , Alan George Ryder 1
Affiliation
|
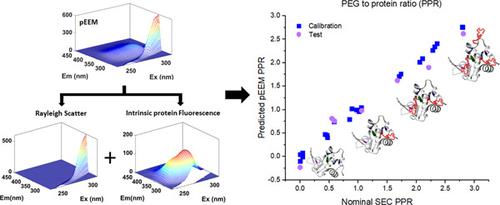
The growing use of therapeutic proteins requires accurate analytical techniques for measuring biophysical and structural changes during manufacturing. This is particularly true for the PEGylation of proteins, because characterization of PEGylation reactions and products can often be difficult due to the relatively small impact on protein structure, the lack of an accessible polyethylene glycol (PEG) chromophore, and the heterogeneous final product mixtures. Intrinsic fluorescence spectroscopy is one potential solution due to its relatively high sensitivity to small changes in protein structure and its suitability for online or atline measurements. In this study, we use the PEGylation of lysozyme as a model system to determine the efficacy of polarized excitation‐emission matrix (pEEM) spectroscopy as a rapid tool for characterizing the structural variability of the lysozyme (LZ) starting materials and PEGylated products with varying PEG‐to‐protein ratios (PPR). Dynamic light scattering showed that as PPR increased from 0 to 2.8, the hydrodynamic radius increased from ∼2.2 to 4.8 nm. pEEM measurements provided several sources of information: Rayleigh scattering to identify size changes and aggregate/particle formation, and fluorescence emission to assess chemical and structural changes. PEGylation induced sufficient physicochemical changes in LZ, which produced changes in the pEEM spectra, largely due to variations in the hydrophobic environments of tryptophan residues close to a PEG attachment site. These significant spectral changes when modeled using conventional multivariate analysis methods were able to easily discriminate the raw product solutions according to the degree of PEGylation and were also able to predict PPR with reasonable accuracy (root mean square error for calibration ∼10%, relative error of prediction < 20%), considering the reference size exclusion chromatography method error of ∼7.2%. The variable selection of the pEEM data suggests that equivalent predictions could be obtained with faster and simpler two‐dimensional spectra, making the method a more viable online measurement method.
中文翻译:

使用偏振激发发射矩阵光谱表征溶菌酶 PEG 化产物。
治疗性蛋白质的使用越来越多,需要准确的分析技术来测量制造过程中的生物物理和结构变化。对于蛋白质的聚乙二醇化尤其如此,因为聚乙二醇化反应和产物的表征通常很困难,因为对蛋白质结构的影响相对较小,缺乏可接近的聚乙二醇 (PEG) 生色团,以及异质的最终产物混合物。本征荧光光谱是一种潜在的解决方案,因为它对蛋白质结构的微小变化具有相对较高的灵敏度,并且适用于在线或在线测量。在这项研究中,我们使用溶菌酶的 PEG 化作为模型系统来确定偏振激发发射矩阵 (pEEM) 光谱作为表征溶菌酶 (LZ) 起始材料和具有不同 PEG 的 PEG 化产物的结构变异性的快速工具的功效蛋白质比率 (PPR)。动态光散射表明,随着 PPR 从 0 增加到 2.8,流体动力学半径从~2.2 增加到 4.8 nm。pEEM 测量提供了多种信息来源:瑞利散射以识别尺寸变化和聚集体/颗粒形成,以及荧光发射以评估化学和结构变化。聚乙二醇化在 LZ 中诱导了足够的物理化学变化,这在 pEEM 光谱中产生了变化,这主要是由于靠近 PEG 附着位点的色氨酸残基疏水环境的变化。当使用传统的多变量分析方法建模时,这些显着的光谱变化能够根据聚乙二醇化程度轻松区分原始产品溶液,并且还能够以合理的准确度预测 PPR(校准的均方根误差约为 10%,相对误差为预测 < 20%),考虑到参考尺寸排阻色谱方法的误差约为 7.2%。pEEM 数据的变量选择表明,可以使用更快、更简单的二维光谱获得等效预测,使该方法成为更可行的在线测量方法。
更新日期:2020-09-12
中文翻译:
使用偏振激发发射矩阵光谱表征溶菌酶 PEG 化产物。
治疗性蛋白质的使用越来越多,需要准确的分析技术来测量制造过程中的生物物理和结构变化。对于蛋白质的聚乙二醇化尤其如此,因为聚乙二醇化反应和产物的表征通常很困难,因为对蛋白质结构的影响相对较小,缺乏可接近的聚乙二醇 (PEG) 生色团,以及异质的最终产物混合物。本征荧光光谱是一种潜在的解决方案,因为它对蛋白质结构的微小变化具有相对较高的灵敏度,并且适用于在线或在线测量。在这项研究中,我们使用溶菌酶的 PEG 化作为模型系统来确定偏振激发发射矩阵 (pEEM) 光谱作为表征溶菌酶 (LZ) 起始材料和具有不同 PEG 的 PEG 化产物的结构变异性的快速工具的功效蛋白质比率 (PPR)。动态光散射表明,随着 PPR 从 0 增加到 2.8,流体动力学半径从~2.2 增加到 4.8 nm。pEEM 测量提供了多种信息来源:瑞利散射以识别尺寸变化和聚集体/颗粒形成,以及荧光发射以评估化学和结构变化。聚乙二醇化在 LZ 中诱导了足够的物理化学变化,这在 pEEM 光谱中产生了变化,这主要是由于靠近 PEG 附着位点的色氨酸残基疏水环境的变化。当使用传统的多变量分析方法建模时,这些显着的光谱变化能够根据聚乙二醇化程度轻松区分原始产品溶液,并且还能够以合理的准确度预测 PPR(校准的均方根误差约为 10%,相对误差为预测 < 20%),考虑到参考尺寸排阻色谱方法的误差约为 7.2%。pEEM 数据的变量选择表明,可以使用更快、更简单的二维光谱获得等效预测,使该方法成为更可行的在线测量方法。


 京公网安备 11010802027423号