当前位置:
X-MOL 学术
›
Comput. Graph. Forum
›
论文详情
Our official English website, www.x-mol.net, welcomes your
feedback! (Note: you will need to create a separate account there.)
DockVis: Visual Analysis of Molecular Docking Trajectories
Computer Graphics Forum ( IF 2.7 ) Pub Date : 2020-07-01 , DOI: 10.1111/cgf.14048 Katarína Furmanová 1 , Ondřej Vávra 2, 3 , Barbora Kozlíková 1 , Jiří Damborský 2, 3 , Vojtěch Vonásek 4 , David Bednář 2, 3 , Jan Byška 1, 5
Computer Graphics Forum ( IF 2.7 ) Pub Date : 2020-07-01 , DOI: 10.1111/cgf.14048 Katarína Furmanová 1 , Ondřej Vávra 2, 3 , Barbora Kozlíková 1 , Jiří Damborský 2, 3 , Vojtěch Vonásek 4 , David Bednář 2, 3 , Jan Byška 1, 5
Affiliation
|
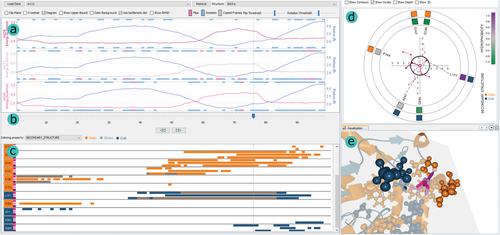
Computation of trajectories for ligand binding and unbinding via protein tunnels and channels is important for predicting possible protein–ligand interactions. These highly complex processes can be simulated by several software tools, which provide biochemists with valuable information for drug design or protein engineering applications. This paper focuses on aiding this exploration process by introducing the DockVis visual analysis tool. DockVis operates with the multivariate output data from one of the latest available tools for the prediction of ligand transport, CaverDock. DockVis provides the users with several linked views, combining the 2D abstracted depictions of ligands and their surroundings and properties with the 3D view. In this way, we enable the users to perceive the spatial configurations of ligand passing through the protein tunnel. The users are initially visually directed to the most relevant parts of ligand trajectories, which can be then explored in higher detail by the follow‐up analyses. DockVis was designed in tight collaboration with protein engineers developing the CaverDock tool. However, the concept of DockVis can be extended to any other tool predicting ligand pathways by the molecular docking. DockVis will be made available to the wide user community as part of the Caver Analyst 3.0 software package (www.caver.cz).
中文翻译:

DockVis:分子对接轨迹的可视化分析
通过蛋白质隧道和通道计算配体结合和解除结合的轨迹对于预测可能的蛋白质-配体相互作用很重要。这些高度复杂的过程可以通过多种软件工具进行模拟,为生物化学家提供用于药物设计或蛋白质工程应用的宝贵信息。本文重点介绍通过引入 DockVis 可视化分析工具来帮助这一探索过程。DockVis 使用来自用于预测配体运输的最新可用工具之一的多变量输出数据,CaverDock。DockVis 为用户提供了多个链接视图,将配体及其周围环境和属性的 2D 抽象描述与 3D 视图相结合。这样,我们使用户能够感知通过蛋白质隧道的配体的空间配置。用户最初在视觉上被引导到配体轨迹的最相关部分,然后可以通过后续分析更详细地探索这些部分。DockVis 是与开发 CaverDock 工具的蛋白质工程师紧密合作设计的。然而,DockVis 的概念可以扩展到任何其他通过分子对接预测配体途径的工具。DockVis 将作为Caver Analyst 3.0 软件包(www.caver.cz) 的一部分提供给广大用户社区。DockVis 是与开发 CaverDock 工具的蛋白质工程师紧密合作设计的。然而,DockVis 的概念可以扩展到任何其他通过分子对接预测配体途径的工具。DockVis 将作为Caver Analyst 3.0 软件包(www.caver.cz) 的一部分提供给广大用户社区。DockVis 是与开发 CaverDock 工具的蛋白质工程师紧密合作设计的。然而,DockVis 的概念可以扩展到任何其他通过分子对接预测配体途径的工具。DockVis 将作为Caver Analyst 3.0 软件包(www.caver.cz) 的一部分提供给广大用户社区。
更新日期:2020-07-01
中文翻译:
DockVis:分子对接轨迹的可视化分析
通过蛋白质隧道和通道计算配体结合和解除结合的轨迹对于预测可能的蛋白质-配体相互作用很重要。这些高度复杂的过程可以通过多种软件工具进行模拟,为生物化学家提供用于药物设计或蛋白质工程应用的宝贵信息。本文重点介绍通过引入 DockVis 可视化分析工具来帮助这一探索过程。DockVis 使用来自用于预测配体运输的最新可用工具之一的多变量输出数据,CaverDock。DockVis 为用户提供了多个链接视图,将配体及其周围环境和属性的 2D 抽象描述与 3D 视图相结合。这样,我们使用户能够感知通过蛋白质隧道的配体的空间配置。用户最初在视觉上被引导到配体轨迹的最相关部分,然后可以通过后续分析更详细地探索这些部分。DockVis 是与开发 CaverDock 工具的蛋白质工程师紧密合作设计的。然而,DockVis 的概念可以扩展到任何其他通过分子对接预测配体途径的工具。DockVis 将作为Caver Analyst 3.0 软件包(www.caver.cz) 的一部分提供给广大用户社区。DockVis 是与开发 CaverDock 工具的蛋白质工程师紧密合作设计的。然而,DockVis 的概念可以扩展到任何其他通过分子对接预测配体途径的工具。DockVis 将作为Caver Analyst 3.0 软件包(www.caver.cz) 的一部分提供给广大用户社区。DockVis 是与开发 CaverDock 工具的蛋白质工程师紧密合作设计的。然而,DockVis 的概念可以扩展到任何其他通过分子对接预测配体途径的工具。DockVis 将作为Caver Analyst 3.0 软件包(www.caver.cz) 的一部分提供给广大用户社区。


 京公网安备 11010802027423号