当前位置:
X-MOL 学术
›
Earth Surf.Process. Land.
›
论文详情
Our official English website, www.x-mol.net, welcomes your
feedback! (Note: you will need to create a separate account there.)
Regional debris‐flow and debris‐flood frequency–magnitude relationships
Earth Surface Processes and Landforms ( IF 2.8 ) Pub Date : 2020-06-30 , DOI: 10.1002/esp.4942 Matthias Jakob 1 , Emily Mark 1 , Scott McDougall 2 , Pierre Friele 3 , Carie‐Ann Lau 1 , Stephanie Bale 1
Earth Surface Processes and Landforms ( IF 2.8 ) Pub Date : 2020-06-30 , DOI: 10.1002/esp.4942 Matthias Jakob 1 , Emily Mark 1 , Scott McDougall 2 , Pierre Friele 3 , Carie‐Ann Lau 1 , Stephanie Bale 1
Affiliation
|
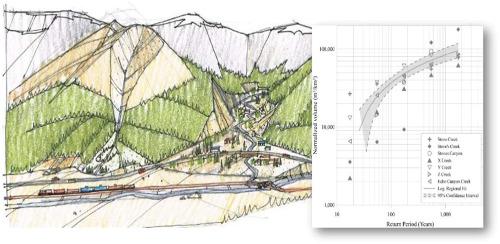
Construction of frequency–magnitude (F–M) relationships of debris floods and debris flows is challenging because of few direct observations, discontinuous event occurrence, loss of field evidence, the difficulty of accessing the sediment archive and the challenge of finding suitable statistical methods to analyse the dataset. Consultants often face budget limitations that prohibit application of the full gamut of absolute dating methods, stratigraphic analysis and analytical tools necessary to fully resolve the F–M legacy. In some cases, F–M curves are needed for watersheds without local information, or where obtaining this information is prohibitively expensive. For such watersheds, the F–M relationship may be estimated where several F–M curves have already been assembled in a specific region. Individual F–M curves are normalized by fan area or fan volume, then stratified by process type and geomorphic activity level. This paper describes the development of regional F–M curves for debris flows in southwestern British Columbia and debris flows and debris floods in the Bow River valley near Canmore, Alberta. We apply the regional relationships to other cases in Canada and the United States and demonstrate that the method can be globalized. The regional approach is compared to cases where detailed F–M relationships have been established by other means. Strong negative deviations from the regional debris‐flow or debris‐flood magnitude trends could signal inherent watershed stability, while strong positive deviations could signal extraordinary landslide processes, or suggest that the fan may be largely of paraglacial origin. We highlight some of these outlying cases and develop a method whereby the regional curves can be meaningfully adjusted, or reliance can be placed on lower or upper confidence bounds of the F–M curves. We caution against the indiscriminate use of the regionally based F–M curves, especially in watersheds where multiple geomorphic processes are active. © 2020 John Wiley & Sons, Ltd.
中文翻译:

区域泥石流和泥石流频率-幅度关系
由于很少有直接观测,不连续事件的发生,现场证据的丢失,难以获得沉积物档案库以及难以找到合适的统计方法来建立泥石流和泥石流的频率-振幅(FM)关系,因此具有挑战性。分析数据集。顾问经常面临预算限制,无法使用全部绝对测年方法,地层分析和分析工具来完全解决F–M遗留问题。在某些情况下,对于没有局部信息的流域或在获取该信息的成本过高的情况下,需要使用F–M曲线。对于这样的分水岭,如果在特定区域已经组装了多条F–M曲线,则可以估算F–M关系。单个F–M曲线通过风机面积或风机体积进行归一化,然后通过过程类型和地貌活动水平进行分层。本文描述了西南不列颠哥伦比亚省的泥石流和阿尔伯塔省坎莫尔附近的弓河谷的泥石流和泥石洪水的区域F–M曲线的发展。我们将区域关系应用于加拿大和美国的其他案例,并证明该方法可以全球化。将区域方法与通过其他方法建立了详细的FM关系的情况进行比较。与区域泥石流或泥石流大小趋势的强烈负偏差可能表示流域内在的稳定性,而强烈的正偏差可能表示滑坡过程异常,或表明扇形岩可能主要来自冰川期。我们重点介绍了其中一些异常情况,并开发了一种方法,可以对区域曲线进行有意义的调整,或者可以依赖于F–M曲线的上下置信区间。我们警告不要随意使用基于区域的F–M曲线,尤其是在多个地貌活动活跃的流域中。分级为4 +©2020 John Wiley&Sons,Ltd.
更新日期:2020-06-30
中文翻译:
区域泥石流和泥石流频率-幅度关系
由于很少有直接观测,不连续事件的发生,现场证据的丢失,难以获得沉积物档案库以及难以找到合适的统计方法来建立泥石流和泥石流的频率-振幅(FM)关系,因此具有挑战性。分析数据集。顾问经常面临预算限制,无法使用全部绝对测年方法,地层分析和分析工具来完全解决F–M遗留问题。在某些情况下,对于没有局部信息的流域或在获取该信息的成本过高的情况下,需要使用F–M曲线。对于这样的分水岭,如果在特定区域已经组装了多条F–M曲线,则可以估算F–M关系。单个F–M曲线通过风机面积或风机体积进行归一化,然后通过过程类型和地貌活动水平进行分层。本文描述了西南不列颠哥伦比亚省的泥石流和阿尔伯塔省坎莫尔附近的弓河谷的泥石流和泥石洪水的区域F–M曲线的发展。我们将区域关系应用于加拿大和美国的其他案例,并证明该方法可以全球化。将区域方法与通过其他方法建立了详细的FM关系的情况进行比较。与区域泥石流或泥石流大小趋势的强烈负偏差可能表示流域内在的稳定性,而强烈的正偏差可能表示滑坡过程异常,或表明扇形岩可能主要来自冰川期。我们重点介绍了其中一些异常情况,并开发了一种方法,可以对区域曲线进行有意义的调整,或者可以依赖于F–M曲线的上下置信区间。我们警告不要随意使用基于区域的F–M曲线,尤其是在多个地貌活动活跃的流域中。分级为4 +©2020 John Wiley&Sons,Ltd.


 京公网安备 11010802027423号