当前位置:
X-MOL 学术
›
NMR Biomed.
›
论文详情
Our official English website, www.x-mol.net, welcomes your
feedback! (Note: you will need to create a separate account there.)
Assessment of cardiac function, blood flow and myocardial tissue relaxation parameters at 0.35 T.
NMR in Biomedicine ( IF 2.7 ) Pub Date : 2020-05-04 , DOI: 10.1002/nbm.4317 Juliet Varghese 1 , Jason Craft 2, 3 , Christopher D Crabtree 4 , Yingmin Liu 1 , Ning Jin 5 , Kelvin Chow 6 , Rizwan Ahmad 1, 7, 8 , Orlando P Simonetti 1, 2, 9
NMR in Biomedicine ( IF 2.7 ) Pub Date : 2020-05-04 , DOI: 10.1002/nbm.4317 Juliet Varghese 1 , Jason Craft 2, 3 , Christopher D Crabtree 4 , Yingmin Liu 1 , Ning Jin 5 , Kelvin Chow 6 , Rizwan Ahmad 1, 7, 8 , Orlando P Simonetti 1, 2, 9
Affiliation
|
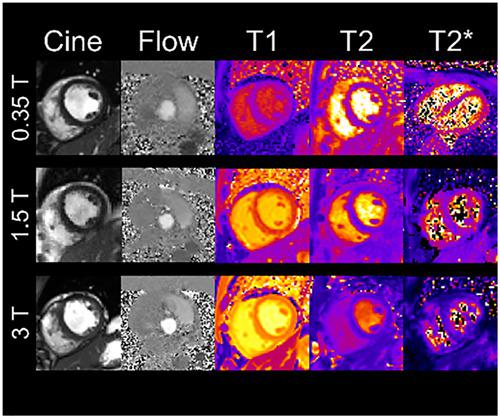
A low field strength (B0) system could increase cardiac MRI availability for patients otherwise contraindicated at higher field. Lower equipment costs could also broaden cardiac MR accessibility. The current study investigated the feasibility of cardiac function with steady‐state free precession and flow assessment with phase contrast (PC) cine images at 0.35 T, and evaluated differences in myocardial relaxation times using quantitative T1, T2 and T2* maps by comparison with 1.5 and 3 T results in a small cohort of six healthy volunteers. Signal‐to‐noise ratio (SNR) differences across systems were characterized with proton density‐weighted spin echo phantom data. SNR at 0.35 T was lower by factors of 5.5 and 15.0 compared with the 1.5 and 3 T systems used in this study. All cine images at 0.35 T scored 3 or greater on a five‐point image quality scale. Normalized blood‐myocardium contrast in cine images, left ventricular volumes (end diastolic volume, end systolic volume) and function (ejection fraction and stroke volume) measures at 0.35 T matched 1.5 and 3 T results. Phase‐to‐noise ratio in 0.35 T PC images (11.7 ± 1.9) was lower than 1.5 T (18.7 ± 5.2) and 3 T (44.9 ± 16.5). Peak velocity and stroke volume determined from PC images were similar across systems. Myocardial T1 increased (564 ± 13 ms at 0.35 T, 955 ± 19 ms at 1.5 T and 1200 ± 35 ms at 3 T) while T2 (59 ± 4 ms at 0.35 T, 49 ± 3 ms at 1.5 T and 40 ± 2 ms at 3 T) and T2* (42 ± 8 ms at 0.35 T, 33 ± 6 ms at 1.5 T and 24 ± 3 ms at 3 T) decreased with increasing B0. Despite SNR deficits, cardiovascular function, flow assessment and myocardial relaxation parameter mapping is feasible at 0.35 T using standard cardiovascular imaging sequences.
中文翻译:

在 0.35 T 时评估心脏功能、血流量和心肌组织松弛参数。
低场强 (B0) 系统可以增加心脏 MRI 的可用性,否则在高场时有禁忌症。较低的设备成本也可以扩大心脏 MR 的可及性。目前的研究调查了使用 0.35 T 相位对比 (PC) 电影图像进行稳态自由进动和血流评估的心脏功能的可行性,并使用定量 T1、T2 和 T2 * 图与 1.5 进行比较评估心肌舒张时间的差异和 3 T 导致一小群六名健康志愿者。跨系统的信噪比 (SNR) 差异的特点是质子密度加权自旋回波幻影数据。与本研究中使用的 1.5 和 3 T 系统相比,0.35 T 的 SNR 降低了 5.5 和 15.0 倍。0 处的所有电影图像。35 T 在五点图像质量量表中得分为 3 或更高。电影图像中的标准化血液 - 心肌对比度、左心室容积(舒张末期容积、收缩末期容积)和功能(射血分数和每搏输出量)在 0.35 T 下测量与 1.5 和 3 T 结果相匹配。0.35 T PC 图像 (11.7 ± 1.9) 中的相噪比低于 1.5 T (18.7 ± 5.2) 和 3 T (44.9 ± 16.5)。从 PC 图像确定的峰值速度和每搏输出量在不同系统中是相似的。心肌 T1 增加(0.35 T 时 564 ± 13 ms、1.5 T 时 955 ± 19 ms 和 3 T 时 1200 ± 35 ms)而 T2(0.35 T 时 59 ± 4 ms、1.5 T 时 49 ± 3 ms 和 40 ± 2 ms at 3 T) 和 T2 * (42 ± 8 ms at 0.35 T, 33 ± 6 ms at 1.5 T and 24 ± 3 ms at 3 T) 随着 B0 的增加而降低。尽管 SNR 缺陷、心血管功能、
更新日期:2020-05-04
中文翻译:
在 0.35 T 时评估心脏功能、血流量和心肌组织松弛参数。
低场强 (B0) 系统可以增加心脏 MRI 的可用性,否则在高场时有禁忌症。较低的设备成本也可以扩大心脏 MR 的可及性。目前的研究调查了使用 0.35 T 相位对比 (PC) 电影图像进行稳态自由进动和血流评估的心脏功能的可行性,并使用定量 T1、T2 和 T2 * 图与 1.5 进行比较评估心肌舒张时间的差异和 3 T 导致一小群六名健康志愿者。跨系统的信噪比 (SNR) 差异的特点是质子密度加权自旋回波幻影数据。与本研究中使用的 1.5 和 3 T 系统相比,0.35 T 的 SNR 降低了 5.5 和 15.0 倍。0 处的所有电影图像。35 T 在五点图像质量量表中得分为 3 或更高。电影图像中的标准化血液 - 心肌对比度、左心室容积(舒张末期容积、收缩末期容积)和功能(射血分数和每搏输出量)在 0.35 T 下测量与 1.5 和 3 T 结果相匹配。0.35 T PC 图像 (11.7 ± 1.9) 中的相噪比低于 1.5 T (18.7 ± 5.2) 和 3 T (44.9 ± 16.5)。从 PC 图像确定的峰值速度和每搏输出量在不同系统中是相似的。心肌 T1 增加(0.35 T 时 564 ± 13 ms、1.5 T 时 955 ± 19 ms 和 3 T 时 1200 ± 35 ms)而 T2(0.35 T 时 59 ± 4 ms、1.5 T 时 49 ± 3 ms 和 40 ± 2 ms at 3 T) 和 T2 * (42 ± 8 ms at 0.35 T, 33 ± 6 ms at 1.5 T and 24 ± 3 ms at 3 T) 随着 B0 的增加而降低。尽管 SNR 缺陷、心血管功能、


 京公网安备 11010802027423号