当前位置:
X-MOL 学术
›
Geosci. Data J.
›
论文详情
Our official English website, www.x-mol.net, welcomes your
feedback! (Note: you will need to create a separate account there.)
Leaf phenology amplitude derived from MODIS NDVI and EVI: Maps of leaf phenology synchrony for Meso‐ and South America
Geoscience Data Journal ( IF 3.3 ) Pub Date : 2020-02-09 , DOI: 10.1002/gdj3.87 France F. Gerard 1 , Charles T. George 1 , Garry Hayman 1 , Cecilia Chavana‐Bryant 2, 3 , Graham P. Weedon 4
Geoscience Data Journal ( IF 3.3 ) Pub Date : 2020-02-09 , DOI: 10.1002/gdj3.87 France F. Gerard 1 , Charles T. George 1 , Garry Hayman 1 , Cecilia Chavana‐Bryant 2, 3 , Graham P. Weedon 4
Affiliation
|
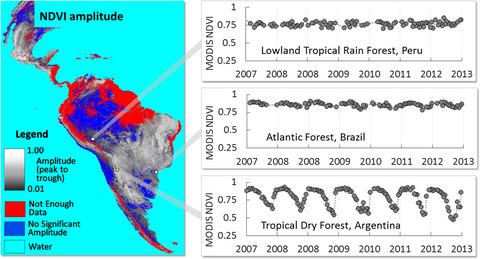
The leaf phenology (i.e. the seasonality of leaf amount and leaf demography) of ecosystems can be characterized through the use of Earth observation data using a variety of different approaches. The most common approach is to derive time series of vegetation indices (VIs) which are related to the temporal evolution of FPAR, LAI and GPP or alternatively used to derive phenology metrics that quantify the growing season. The product presented here shows a map of average ‘amplitude’ (i.e. maximum minus minimum) of annual cycles observed in MODIS‐derived NDVI and EVI from 2000 to 2013 for Meso‐ and South America. It is a robust determination of the amplitude of annual cycles of vegetation greenness derived from a Lomb–Scargle spectral analysis of unevenly spaced data. VI time series pre‐processing was used to eliminate measurement outliers, and the outputs of the spectral analysis were screened for statistically significant annual signals. Amplitude maps provide an indication of net ecosystem phenology since the satellite observations integrate the greenness variations across the plant individuals within each pixel. The average amplitude values can be interpreted as indicating the degree to which the leaf life cycles of individual plants and species are synchronized. Areas without statistically significant annual variations in greenness may still consist of individuals that show a well‐defined annual leaf phenology. In such cases, the timing of the phenology events will vary strongly within the year between individuals. Alternatively, such areas may consist mainly of plants with leaf turnover strategies that maintain a constant canopy of leaves of different ages. Comparison with in situ observations confirms our interpretation of the average amplitude measure. VI amplitude interpreted as leaf life cycle synchrony can support model evaluation by informing on the likely leaf turn over rates and seasonal variation in ecosystem leaf age distribution.
中文翻译:

从MODIS NDVI和EVI得出的叶片物候振幅:中南美洲的叶片物候同步图
生态系统的叶片物候(即叶片数量和叶片人口统计的季节性)可以通过使用各种不同方法的地球观测数据来表征。最常见的方法是得出与FPAR,LAI和GPP的时间演变有关的植被指数(VI)的时间序列,或者可用于得出量化生长季节的物候指标。此处介绍的产品显示了2000年至2013年间在中美洲和南美洲从MODIS得出的NDVI和EVI中观测到的年周期的平均“振幅”(即最大负最小值)图。这是从不均匀分布的数据的Lomb-Scargle光谱分析得出的植被绿色度年循环幅度的可靠确定。VI时间序列预处理用于消除测量异常值,并对频谱分析的输出进行筛选,以获取具有统计意义的年度信号。振幅图提供了净生态系统物候的指示,因为卫星观测将每个像素内植物个体之间的绿色度变化进行了整合。平均幅度值可以解释为指示单个植物和物种的叶片生命周期同步的程度。年度绿度没有统计学上显着变化的区域可能仍然由表现出明确的年度叶片物候特征的个体组成。在这种情况下,个体之间一年内物候事件的发生时间会发生很大变化。可替代地,这些区域可以主要由具有叶片更新策略的植物组成,该策略维持不同年龄的叶片的恒定冠层。与原位观测的比较证实了我们对平均幅度测量的解释。被解释为叶片生命周期同步的VI振幅可通过告知可能的叶片周转率和生态系统叶片年龄分布的季节性变化来支持模型评估。
更新日期:2020-02-09
中文翻译:
从MODIS NDVI和EVI得出的叶片物候振幅:中南美洲的叶片物候同步图
生态系统的叶片物候(即叶片数量和叶片人口统计的季节性)可以通过使用各种不同方法的地球观测数据来表征。最常见的方法是得出与FPAR,LAI和GPP的时间演变有关的植被指数(VI)的时间序列,或者可用于得出量化生长季节的物候指标。此处介绍的产品显示了2000年至2013年间在中美洲和南美洲从MODIS得出的NDVI和EVI中观测到的年周期的平均“振幅”(即最大负最小值)图。这是从不均匀分布的数据的Lomb-Scargle光谱分析得出的植被绿色度年循环幅度的可靠确定。VI时间序列预处理用于消除测量异常值,并对频谱分析的输出进行筛选,以获取具有统计意义的年度信号。振幅图提供了净生态系统物候的指示,因为卫星观测将每个像素内植物个体之间的绿色度变化进行了整合。平均幅度值可以解释为指示单个植物和物种的叶片生命周期同步的程度。年度绿度没有统计学上显着变化的区域可能仍然由表现出明确的年度叶片物候特征的个体组成。在这种情况下,个体之间一年内物候事件的发生时间会发生很大变化。可替代地,这些区域可以主要由具有叶片更新策略的植物组成,该策略维持不同年龄的叶片的恒定冠层。与原位观测的比较证实了我们对平均幅度测量的解释。被解释为叶片生命周期同步的VI振幅可通过告知可能的叶片周转率和生态系统叶片年龄分布的季节性变化来支持模型评估。


 京公网安备 11010802027423号